Solving Memory Leaks without Heap Dumps

Sometimes you may not want to do a heap dump. You may be running in an environment which is sensitive to latencies. Or you may be forbidden to create heap dumps, since the content will contain all your customer information and all of your organization’s account numbers, and if the dump ended up in the wrong hands, your entire business would be done for. Or you may have an 800+GB heap (yes, some customers run Java with enormous heaps with great success). And even worse, you may have a huge heap, with a relatively small ephemeral disk storage, not even able to store your huge heap dump. And, quite frankly, even if you get your 800+GB heap dump to your puny laptop, how will you open it? How much time will it take to calculate a dominator tree over that dump?

No matter the reason for you not wanting to do a heap dump, there is now (well, since JDK 10 really), a new JFR event allowing you to solve memory leaks without having to do full heap dumps with very little overhead. Black magic you say? Yes, awesome, yummy, black magic.

The Old Object Sample Event

At the heart of the red pentagram (with a black wax candle on each point and encircled with salt) is the Old Object Sample event. It was introduced in JDK 10. It basically tracks a fixed number of objects on the heap, for as long as they are live. To not incur massive overhead, they are selected in a similar way that the allocation event samples are picked – upon retiring a TLAB, or when allocating outside of TLABs. So, a sampled subset of the allocations get tracked.

When a sample is chosen, the allocation time gets stored together with the allocation stack trace, the thread id, the type of object being allocated, and the memory address of the object. If it’s an array, we also record the array size,

The samples are then stored in a fixed size (256 by default) combined priority queue/linked list, with weak references to the samples. If sampled objects are garbage collected, they are removed and the priority redistributed to the neighbours. The priority is called span, and is currently the size of the allocation, giving more weight to larger (therefore more severe) leaks.

Once the recording is dumped, the paths back to the GC roots can be calculated. I write can, since this is optional – it is something that must be enabled in the recording, or as a parameter to e.g. jcmd when dumping the recording. If the reference chain is very deep (>256 object references), the reference chain will be truncated. It is also possible to specify a time budget, so that the time searching references can be limited. For example, imagine a linked list occupying most of the heap, and the sampled object being the tail of that list. The reference chain for that tail sample would span almost the entirety of the heap. With a large time budget, you would still get a truncated sample. If you don’t want to spend so much time searching the heap, you could limit the time budget.

In other words, the Old Object Sample event contains a lot of exciting information:

  • Time of allocation
  • The thread doing the allocation
  • The last known heap usage at the time of allocation
    (Which can be used to plot the live set, even if we don’t have data from the time of allocation anymore.)
  • The allocation stack trace
    (In other words, where was this object allocated?)
  • The reference chain back to the GC root at the time of dumping the recording
    (In other words, who is still holding on to this object?)
  • The address of the object

There is some additional information. You can check out IMCOldObject in the OpenJDK JMC project source for more details.

Here is an Old Object Sample event shown in the JMC 7 Properties view:

image

Using the Old Object Sample Event

The best way to use the Old Object Sample event is to use it in a long running application. The longer the better. Statistically speaking, you want to offer as many chances as possible for a leaked object to end up being sampled. You’d also want to be well beyond the loading of all your code. Also, you would want to have been running long enough to be sure that transients have been cleared out. For example, if you have a session time-out of some kind set to 2 hours, and a ginormous application server and even larger application taking 15 minutes to start, then the first 2 hours and 15 minutes of runtime will not be that exciting from a memory leak hunting perspective.

A simple way of using the event is to simply go look for events still around after the warmup phase, but before transient objects could reasonably still be around. An even simpler rule of thumb – look at the ones allocated in the middle of the time span. Winking smile

image

Since there is currently a bug open on JMC 7 (JMC 7 has not been released yet; we hope to fix it before we release), “picking the middle” is not yet possible. That said, in the picture above we can see that most live objects being tracked are actually held on to by the Leak$DemoThread, which has a Hashtable (what can I say, it’s a really old example program), having an entry array, containing an entry holding on to a Leak$DemoObject which in turn holds on to a leaked char[].

Now, JMC has a more sophisticated algorithm for selecting good candidates than “go for the ones in the middle”. It first check if we have an increasing live set. If so, and if we have Old Object Sample information, we will try to find good candidates using a combination of the distance from the root, the ratio of how many objects this candidate keeps alive to how many objects its root keeps alive and the ratio of how many objects the candidate keeps alive to how many objects are alive globally. For more information, check out the ReferenceTreeModel in the JMC project.

This has already become a much longer post than I was planning on. Anyways, if you want to experiment a bit with the Old Object Sample event, I have an upcoming JMC and JFR Tutorial that I am planning on “releasing” when JMC 7 is out. That said, you can already beta test it. There is some more information in the blog entry prior to this one.

The Practical Guide to the Old Object Sample Event

If you use the continuous template, this is recorded:

  • Timestamp
  • Thread
  • Object Type

If you use the profile template, this is recorded:

  • Timestamp
  • Thread
  • Object Type
  • Allocation stack trace

If you ask for paths-to-gc-roots you also get the reference chains. This can be done by:

  • Adding it as a parameter on the command line:
    -XX:StartFlightRecording=path-to-gc-roots=true
  • By asking for it when dumping the flight recorder, for example using jcmd:
    jcmd <pid> JFR.dump path-to-gc-roots=true

You can also configure the number of objects to track by setting the old-object-queue-size in the flight recording options, for example:

-XX:FlightRecordingOptions=old-object-queue-size=256

If you want to configure the cutoff for how long to search for references, that can be done in the template file, for example, these are the default settings in the profile template (JDK_HOME/lib/jfr/profile.jfc):

    <event name="jdk.OldObjectSample">
      <setting name="enabled" control="memory-leak-detection-enabled">true</setting>
      <setting name="stackTrace" control="memory-leak-detection-stack-trace">true</setting>
      <setting name="cutoff" control="memory-leak-detection-cutoff">0 ns</setting>
    </event>

Summary

  • The Old Object Sample event is awesome
  • It can, among other things, be used to hunt down memory leaks without doing hprof heap dumps
  • It will also bring you luck, good fortune, not to mention smells good
Sneak Peek of JDK Mission Control 7 Tutorial

Even though JMC 7 is not GA yet, I thought I’d make the upcoming JMC Tutorial available on my GitHub. Hopefully this will be a good resource to help to learn more about using Mission Control 7 and Flight Recorder in OpenJDK 11.

It does takes a bit of preparation to run it for now:

  • JDK Mission Control will need to be built from source, since there are no update sites available yet
  • JOverflow will not work until JMC-6121 is solved
  • Exercise 5 will be better once JMC-6127 is solved

That said, all the preparations needed are listed in the README.md file in the GitHub repo:

https://github.com/thegreystone/jmc-tutorial

Please let me know if something is missing from the instructions!

My Sessions at Code One 2018

If anyone would like to catch up with me at Code One, here are some specific times where my location is known in advance. 😉

Session Title

ID

Date Start Time End Time

Room

Contributing to the Mission Control
OpenJDK Project

[DEV4506]

Monday,
Oct 22

10:30

11:15

Moscone West
Room 2004
Robotics on Java Simplified

[DEV6089]

Monday,
Oct 22

14:30

15:15

Moscone West
Room 2024

Production-Time Profiling
and Diagnostics on the JVM

[DEV4507]

Wednesday,
Oct 24

10:30

11:15

Moscone West
Room 2004
OpenJDK Mission Control:
The Hands-on-Lab

[HOL4508]

Wednesday,
Oct 24

12:30

14:30

Moscone West
Room 2001A

Diagnose Your Microservices:
OpenTracing/Oracle Application
Performance Monitoring Cloud

[DEV5435]

Wednesday,
Oct 24

16:00

16:45

Moscone West
Room 2011

Getting Started with the
(Open Source) JDK Mission Control

[DEV4509]

Thursday,
Oct 25

11:00

11:45

Moscone West
Room 2014

Note that the last few years, the HoL has been full – it may be a good idea to register for it early. Especially now that JMC/JFR is being open sourced (JDK 11, JMC 7).

Looking forward to seeing you at Code One!

Here is a link to the sessions in the content catalogue.

Update Your Third Party Dependencies!

Now that Eclipse Photon has been released, there are a few things you need to do to keep your JMC builds happy.

  1. Get the latest changes:
    hg pull
    hg update

  2. Rebuild the third-party dependencies (new terminal):
    cd releng/third-party
    mvn p2:site
    mvn jetty:run

  3. Build it all (in the jmc root folder):
    mvn clean package

If you have imported JMC into Eclipse, you also need to change the target platform. Simply remove the old target platform (Preferences | Plug-in Development / Target Platform):

image

Then press “Apply and Close”.

Next open the releng/platform-definitions/platform-definition-photon/platform-definition-photon.target file (File | Open File…). In the upper right corner, press Set as Active Target Platform.

image

JMC should now rebuild!

Done!

Developing OpenJDK Mission Control

The last blog (about Fetching and Building OpenJDK Mission Control) earned me questions on how to get the source into Eclipse to start playing around with it. This blog post will assume that you have first successfully completed the steps in the Fetching and Building OpenJDK Mission Control blog post.

Getting Eclipse

First of all you should download the latest version of Eclipse. JMC is an RCP application, and thus, the easiest way to make changes to it, is to use the Eclipse IDE.

There are various Eclipse bundles out there. Get (at least) the Eclipse IDE for Eclipse Committers. It adds some useful things, like PDE (the Plugin Development Environment), Git, the Marketplace client and more. You can also use the Eclipse IDE for Java Enterprise Developers.

You will need an Eclipse 2018-12 or later!

To get to the screen where you can select another packaging than the standard, click on the Download Packages link on the Eclipse download page.


Install it, start it and create a new workspace for your JMC work. Creating a new workspace is as easy as picking a new name when starting up your Eclipse in the dialog asking for a directory for the workspace:
image

Installing JDKs

Since you’ve already built JMC outside of the IDE, you already have a JDK 8. You probably also want to have a JDK 11 set up in your Eclipse.

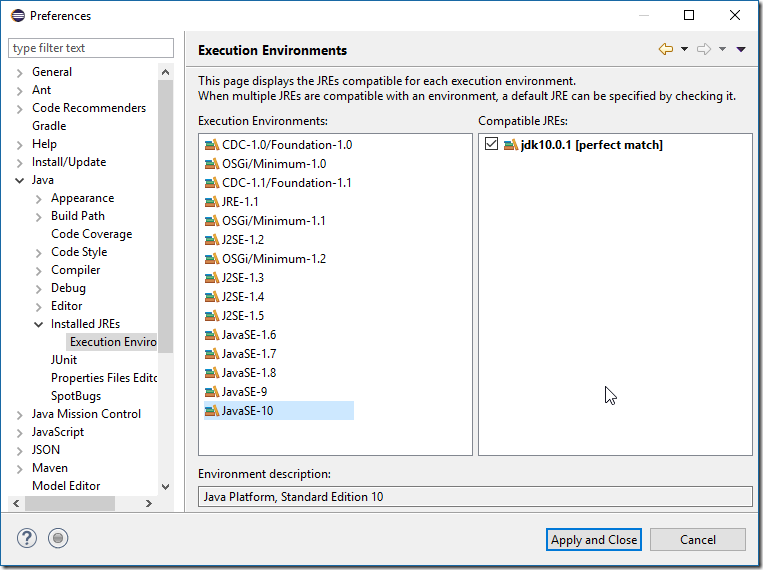
Download and install a JDK11, then open Window | Preferences and then select Java / Installed JREs. Add your favourite JKD 8 and JDK 11 JDKs (Add…) and then use Java / Installed JREs / Execution Environments to set them as defaults for the JDK 8 and JDK 11 execution environments.

Note to JMC lovers:

You may want to ensure that a JDK is used to run your Eclipse, and not a jre. A JDK is needed for JMC to find the tools.jar, where the classes required for JMC to discover locally running JVMs are located. Simply add the –vm flag in your eclipse.ini file, and point it to your JDK:

image


Setting installed JREs:

image

Setting execution environments:

image

Okay, we now have our JDKs set up. Next step is to set up a user library for things that JMC will need from the JDK. This is directly from the JMC readme:

If importing the application projects, make sure you create a user library (Preferences | Java/Build Path/User Libraries) named JMC_JDK, and add (Add External JARs…) the following JARs from a JDK 8 (u40 or above) to the User Library: tools.jar (/lib/tools.jar), jconsole.jar (/lib/jconsole.jar), jfxswt.jar (/jre/lib/jfxswt.jar), and finally the jfxrt.jar (/jre/lib/ext/jfxrt.jar).

Creating the user library:

image

Adding the jars:

image

Now we need to check a few things…

Checkpoint

Is the Jetty server from the previous blog up and running?
image

If yes, go ahead and open up the target file available under releng/platform-definitions/platform-definition-photon (File | Open File). You should see something like this:

image

Click the Set as Active Target Platform link in the upper right corner.

Now there is one final preparation for the import – we need to turn of certain Maven settings. Go to the preferences, and select Maven / Errors/Warnings. Set Plugin execution not covered by lifecycle configuration to Ignore, and also Out-of-date project configuration to Ignore

image

Now the preparations are done, and we can start importing the projects. Woho!

Importing the Projects

First we will have to import the core projects, since they are built separately from the rest. Select File | Import… and select Maven / Existing Maven Project.
image

Click next, and browse into the jmc/core folder. Select all the core projects and import them. (You may want to skip the top level poms.)

Next select File | Import… and select Maven / Existing Maven Project again, but this time from the root:

Again, you may want to skip the top level poms (/pom.xml, application/pom.xml etc), and the uitests (at least until we fix so that the jemmy dependency can be downloaded from Maven Central).
image

Next we will import the project which contains the launchers. Select File | Import… and then select Existing Projects into Workspace. Find the configuration/ide/eclipse folder and click Ok.

image

After importing that project, we can now launch JMC from within Eclipse:

image

Or run it in debug mode:

image

Configuring Development Settings

If you don’t plan on submitting any changes, then this step is optional. The team use shared settings for formatter and macros. Go to the preferences and then to Java / Code Style / Formatter. Then click Import… and select the configuration/ide/eclipse/formatting/formatting.xml. You should now have the Mission Control formatting settings active:

image

Optional:

If you have the spotbugs plug-in installed, you should also import the spotbugs excludes (configuration/spotbugs/spotbugs-exclude.xml). There is also a common dictionary (configuration/ide/eclipse/dictionary/dictionary.txt) and templates (configuration/ide/eclipse/templates/JMC templates.xml) which you may find useful.

Adding (and Launching with) Some Custom Plug-in

The flame graph view may be included in JMC at some point. If so, then there will probably be some other plug-in somewhere that will serve as an example.

First install Git. If you, on the command line, can run git –version, you’re all set.

Next go to your git folder (or wherever you keep your git projects) and clone the jmc-flame-view repo:

git clone https://github.com/thegreystone/jmc-flame-view

Next go to Eclipse and do File | Import…, and select Existing Projects into Workspace. Select your jmc-flame-view folder, and click Finish:

image

Next we need a launcher which includes this new feature. Go to the org.openjdk.jmc.eclipseonfig project and open the launchers folder. Copy and paste the JMC RCP plug-ins.launch file. Name the copy something.

image

Click the run dropdown and select Run Configurations….

image

Select your new launcher, and click the Plug-ins tab. Add the new Flame Graph feature:

image

Click Apply and Run. Mission Control will start, with your new plug-in available. In the started JMC, go to Window | Show View | Other…. Select Mission Control / Flame Graph in the Show View dialog. Open a Flight Recording, and click on something that would yield an aggregated stack trace, such as something in the Method Profiling page, or a class in the Memory page – you should now see a Flame Graph of your selection.

Summary

This blog post explained, in some detail, how to import the OpenJDK Mission Control project into Eclipse, and how to set up the workspace to work on the code. It also explained how to run the code with an additional plug-in from a separate repo.

As always, please let me know if I forgot to mention something (except for the agent, which I will deal with in a separate post)!

Fetching and Building OpenJDK Mission Control

(Please note that an updated version of this article, for JMC 8+, is available here: https://hirt.se/blog/?p=1196.)

Since people keep asking me, I thought I’d put together this quick primer on how to get started with OpenJDK Mission Control. Now, once the early access builds of JMC 7 is out, that will probably be the easiest way to get started for people who don’t want to change stuff. This blog, however, will be for the ones of you who would like to build JMC from source.

Getting Mercurial

First step is to get Mercurial, the SCM used for OpenJDK. JMC (being an OpenJDK project) is available through a Mercurial repository. Installing Mercurial is different for different platforms:

Mac OS X

Easiest is to install through Homebrew:

brew install mercurial

That said, dmg packages can also be downloaded from here: https://www.mercurial-scm.org/wiki/Download.

Windows

Go to https://www.mercurial-scm.org/wiki/Download. Download the InnoSetup based installer and run it. Ensure that the “add to path” checkbox is checked. Verify that the install went fine by opening a command prompt and typing hg and enter. A list of the available commands should be printed.

Linux

For Debian based distributions, you can install using the package manager:

sudo apt-get install mercurial

That said, you can also get rpms and other installation packages from here: https://www.mercurial-scm.org/wiki/Download.

Cloning the Source

Once Mercurial is installed properly, getting the source is as easy as cloning the jmc repo. First change into the directory where you want to check out jmc. Then run:

hg clone http://hg.openjdk.java.net/jmc/jmc/

Getting Maven

Since you probably have some Java experience, you probably already have Maven installed on your system. If you do not, you now need to install it. Simply follow the instructions here:

https://maven.apache.org/install.html

Building Mission Control

First we need to ensure that Java 8 is on our path. Some of the build components still use JDK 8, so this is important.

java –version

This will show the Java version in use. If this is not a Java 8 JDK, change your path. Once done, we are now ready to build Mission Control. Open up two terminals. Yep, two!

In the first one, go to where your cloned JMC resides and type in and execute the following commands (for Windows, replace the dash (/) with a backslash (\)):

cd releng/third-party
mvn p2:site
mvn jetty:run

Now, leave that terminal open with the jetty running. Do not touch.

In the second terminal, go to your cloned jmc directory. First we will need to build and install the core libraries:

cd core
mvn install

Next run maven in the jmc root:

mvn clean package

JMC should now be building. The first time you build Maven will download all of the third party dependencies. This will take some time. Subsequent builds will be less painful. On my system, the first build took 6:01 min. The subsequent clean package build took 2:38.

Running Mission Control

To start your recently built Mission Control, run:

Windows

target\products\org.openjdk.jmc\win32\win32\x86_64\jmc.exe -vm %JAVA_HOME%\bin

Mac OS X

target/products/org.openjdk.jmc/macosx/cocoa/x86_64/JDK\ Mission\ Control.app/Contents/MacOS/jmc -vm $JAVA_HOME/bin

Contributing to JDK Mission Control

To contribute to JDK Mission Control, you need to have signed an Oracle Contributor Agreement. More information can be found here:

http://openjdk.java.net/contribute/

Don’t forget to join the dev list:

http://mail.openjdk.java.net/mailman/listinfo/jmc-dev

If there is interest, I will add a more detailed blog post on this later.

More Info

For more information on how to run tests, use APIs etc, there is a README.md file in the root of the mercurial repo. Let me know in the comments section if there is something you think I should add to this blog post and/or the README!

JMC Open Sourced!

This is going to be a short blog post, because it is past bedtime and I’m frankly pretty beat. Just wanted to say thank you to everyone who helped open source Java Mission Control in the relatively short period of time it was done in.

So a huge thank you to everyone on the Stockholm JMC team: Klara Ward, Ola Westin, Henrik Dafgård, Erik Greijus and Per Kroon. And to Dalibor Topic, who had the thankless job to go through all the source and built artifacts checking on, among other things, licenses and copyrights. Also thank you to Donald Smith for handling the internal license approval process, and Mark Reinhold for advice. Also, a big thank you to Guru, who is prepping to start building Oracle binary builds of the OpenJDK project. And to Iris who published the repos and set up the project on OpenJDK. And to everyone who I’ve forgotten to mention, since my brain is no longer really functioning at 2 a.m. You guys rock!

The repositories are available here:

      http://hg.openjdk.java.net/jmc

  • The jmc repo contains the source, which is buildable using Maven.
    Everything you need to know about building JMC is in the README.txt
    Please read it first, thoroughly, before asking questions.
  • The jmc-graphics repo contains artwork and graphic files, like splash screens and icons.

We also have a slack at https://jdkmissioncontrol.slack.com/.

If you have any questions, don’t hesitate to ask!

Kind regards,
Marcus

JMC & JFR in JDK 9 Labs

So JavaOne 2017 has now come and gone. This year it was a pretty great one! The Java keynote was IMHO the best one in years, with plenty of great announcements and interesting content. The sessions I managed to attend were also very high quality. Not to mention the dinners and the parties. Winking smile

One of the sessions I did this year was a hands-on-lab on Java Mission Control 6 and Java Flight Recorder in JDK 9.

IMG_6670

Since it was full, and since people who could not attend have asked for it, I promised to put the HoL on my blog. Well, here it is!

There are three files:

  1. The lab instructions.
  2. The full lab content for Windows x64 (easiest, but largest download, 856MiB).
  3. The project files only (all other platforms, 39MiB).

Hope this helps!

Please let me know if you find any errors in the labs, or if you get stuck!

/M