Exception profiling is the business of finding out what exceptions are being thrown within your application and from where. In JRockit Mission Control you can find out how many exceptions have been thrown using JRA, and you can count the exceptions using the JRockit Management Console. Sadly there is no way of doing powerful exception profiling (i.e. looking at the stack traces for the exceptions, aggregating them and visualizing them directly in the JRockit Mission Control Client) just yet. This will be incorporated in a future version of Mission Control.
There is fortunately a way to do exception profiling with JRockit today. There are exception related verbose flags available in JRockit. These are examples on how to use them:
java -Xverbose:exceptions=debug …
java -Xverbose:exceptions=trace …
For a list of valid verbose options, please see http://e-docs.bea.com/jrockit/jrdocs/refman/optionX.html#wp999543.
Sometimes you really just want to enable this profiling for a little while, for example to avoid cluttering your log files. Then there is a nifty tool for JRockit called jrcmd you can use to turn on/off the exception profiling. It can be found under JROCKIT_HOME\bin\.
First use jrcmd to list all running java processes. Here is an example of what it may look like:
>jrcmd
10984 jrockit.tools.jrcmd.JrCmd
9396 C:\Java\eclipse3.3.1.1\plugins\org.eclipse.equinox.launcher_1.0.1.R33x_v200
70828.jar -data D:\Data\workspaces\workspace_3.3_facade -os win32 -ws win32 -arc
h x86 -showsplash -launcher C:\Java\eclipse3.3.1.1\eclipse.exe -name Eclipse –l
auncher.library C:\Java\eclipse3.3.1.1\plugins\org.eclipse.equinox.launcher.win3
2.win32.x86_1.0.2.R331_v20071019\eclipse_1021.dll -startup C:\Java\eclipse3.3.1.
1\plugins\org.eclipse.equinox.launcher_1.0.1.R33x_v20070828.jar -exitdata 1908_7
c -vm D:\jrockits\R27.4.0_R27.4.0-90_1.5.0\bin\javaw.exe -vmargs -Xms256m -Xmx51
2m -XgcPrio:deterministic -XpauseTarget:40 -Dosgi.bundlefile.limit=100 -jar C:\J
ava\eclipse3.3.1.1\plugins\org.eclipse.equinox.launcher_1.0.1.R33x_v20070828.jar
10976 Gegga
The numbers are the PIDs of the processes, and are used as the first argument to jrcmd to specify on what JRockit to address. You can use jrcmd to check what commands are available. Here is an example:
>jrcmd 10976 help
10976:
The following commands are available:
kill_rmp_server
start_rmp_server
kill_management_server
start_management_server
checkjrarecording
stopjrarecording
startjrarecording
print_object_summary
memleakserver
print_codegenlist
print_class_summary
run_optfile
dump_codelayout
dump_codelist
dump_codemap
print_utf8pool
print_properties
print_threads
datadump_request
runsystemgc
runfinalization
heap_diagnostics
oom_diagnostics
print_exceptions
version
timestamp
command_line
memprof
sanity
verbosity
set_filename
help
print_memusage
For more information about a specific command use ‘help <command>’.
Parameters to commands are optional unless otherwise stated.
Let’s get more information about the print_exceptions command:
>jrcmd 10976 help print_exceptions
10976:
Enable printing of Java exceptions thrown in the VM.
To turn exception printing off completely you need to set exceptions = false
even if it was turned on by stacktraces = true. NOTE: This handler is
deprecated. The preferred way of displaying exceptions is to use the
‘exceptions’ logging module: -Xverbose:exceptions.
Values for the parameters can be "true|all|false"
true – print all exception except java/util/EmptyStackException,
java/lang/ClassNotFoundException and
java/security/PrivilegedActionException
all – print all exception
false – don’t print exceptions
exceptions – print exceptions (string, false)
stacktraces – print stacktrace (string, false)
Never mind that it is using an old handler in R27.6. The functionality will be the same. Let’s enable the exception profiling:
>jrcmd 10976 print_exceptions stacktraces=true
If your application is throwing exceptions, you should now be seeing traces being logged to the console of that application. To turn off the exception logging, we do as the help suggests:
>jrcmd 10976 print_exceptions exceptions=false
Now, an even easier way to access the jrockit diagnostic commands is to use the JRockit Management Console. Simply connect the JRockit Management Console to the JRockit you wish to enable exception profiling on (from JRockit Mission Control). (Click the images to look at them in full size.)

Once the console is started, open the MBean Browser tab and move to the DiagnosticCommand MBean under bea.jrockit.management:

Double clicking on the ArrayList value of AllCommands will open up a list of all the available commands:

Now, select the operations tab and the executeDefault method that takes a String argument and press invoke. This will provide you with a dialog with push buttons for the arguments. In this case a single button with the label String. Press the String button and fill out the command. For example, print_exceptions stacktraces=true.
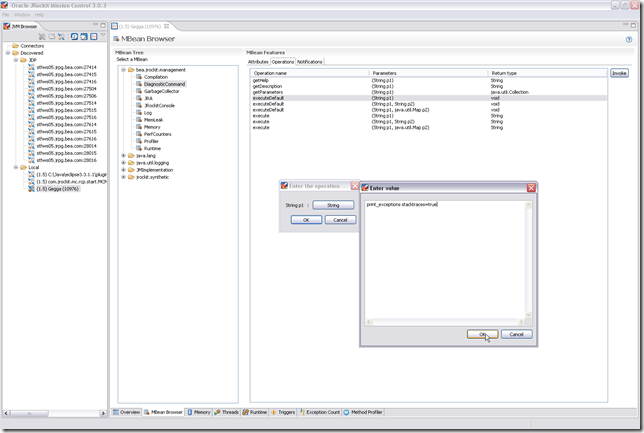
Press Ok on both of the dialogs and exception profiling should now be enabled. To turn it off again, just invoke the operation again and enter print_exceptions exceptions=false, analogously with how you would use jrcmd.
An even easier way for Oracle employees is to pick up a recent internal build of JRockit and use the Diagnostic Command tab in the JRockit Management Console. 🙂 Soon coming to a JRockit near you!


