Using the Operative Set

The Operative Set is an easily overlooked but quite powerful feature in the Mission Control Flight Recorder user interface. It is a selection of events that you can reach and utilize from almost every tab in the Flight Recorder user interface.

This blog will explain how the Operative Set can be used to quickly drill down into a set of events having some very specific properties. The Operative Set may take a bit of time and experimenting to get used to. If you want to try out this feature whilst reading this blog, I’ve made the actual recording used in the examples available here.

Note: If JMC warns you the recording is too large, see this blog post.

Altering the Operative Set

Before we start using the Operative Set, I’ll just note that the tab groups in JMC really are of two different types:

    1. Tab groups specific to one or more specific event types.
      These tab groups are pre-configured to show off specific events. The Event Types view will not affect what is shown in the tab groups.
    2. The general Events tab group.
      The tabs in this tab group will show events of the event types selected in the Event Types view.

The event type specific tabs are usually used to add and remove events of interest to/from the operative set, and the general events can be used to both study and modify the set of events in the operative set. The general Events tabs are also the only way to analyse events of types for which there is no specific user interface. Of course, it is easy to build a new user interface for events where there is no specific user interface yet, but that is for another blog post.

To alter the Operative Set, simply select the events that you want to add/remove and use the context menu. For example, to add the the events for the most contended lock, simply go to the contention tab, right click on the row representing what you’re interested in, go to the Operative Set menu, then choose Add Selection.

image

Voila – the events have now been added to the Operative Set. You can now move over to the general Events tabs to play with them.

Using the Tabs in the Events Tab Group

The first thing to check when moving over to the Events tabs, is to make sure that the events of interest aren’t filtered out. This is done by checking the settings of the Event Type view, which is normally to the left of the Flight Recorder editor.

image

In our case, we have just added Java Monitor Blocked event to the Operative Set, so there isn’t anything else we need to do. When in doubt, enable all event types.

So let’s see what the Events tabs can be used for.

Overview

This tab is a good place to sanity check what you actually have in your operative set. Click the checkboxes for the Operative Set, and you will see what producers the events originate from, as well as the distribution per event type. This page will be quite boring with our current selection of events.

image

Log

The Log is simply a table of the available events. When you select one of the events, all information (attribute values) in the event will be shown to you in the lower half of the tab. Again you can opt to only see what is in the Operative Set. Note that in the 5.2.0 version of Mission Control, this is one of the places where you’ll get to see the actual line number in the stack traces. This means that if you’re not happy with the line number-less traces in the aggregated stack traces, you can always select to add the events you are interested to the operative set, and then look at the events in the log.

image

Graph

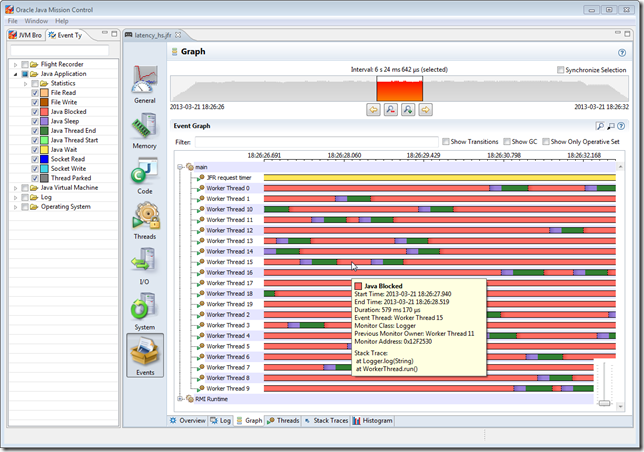
The graph view will show you the events in a per thread graph. This is very useful to get a visualization of what is happening in terms of distribution over both threads and time. In our simple example, we can make out what threads are involved in blocking on the log4j logger, as well as the time periods for which we have contention.

image

Threads

The threads simply list the events aggregated per thread. This can be useful for setting the operative set to only the events occurring in a certain thread.


Stack Trace

In this tab the aggregated stack traces for the selected events can be viewed:

image

It can be noted that for the events in our Operative Set (the blocking events), we seem to spending the most time waiting to do tracing rather than debug or info level logging.


Histogram

This tab is not for creating graphical histograms, but rather for grouping events on a specified attribute. In our case we can for instance select to group our events on monitor address, then select to set the operative set to the busiest lock:

image

Then we can, for example, move back to check what threads are involved in locking on the particular lock instance.

The Relational Key

Now, there is something called a relational key in the event metadata for an attribute. The relational key is used to tell that an attribute contains a value that can bind together events of different event types. For instance all the different GC events that are associated with a certain GC ID are connected through a relational key:

image

The Operative Set context menu has a submenu called Add Related Events. That menu will typically try to be helpful by listing attributes that have a relational key. So for instance, to find all GC events that are related to the longest garbage collection taking place in the recording, go to the Memory tab group, select the Garbage Collections tab and sort the GC table on time. Next select the longest recording and choose Operative Set | Add Related Events | With GC ID = (the id of the longest GC in the supplied recording has ID 76).

image

Looking at the log, you can, for example, look at all the related GC events in the log tab:
image


Putting it All Together

So let’s look at what is happening during an invocation of the viewPatients servlet at the different levels of the recording. First go to the servlet tab in the WebLogic tab group, next right click in the table and select Operative Set | Clear. Most WLS events are related to a certain request using something called the ECID (Enterprise Context ID). Let’s next add the events associated with the first found ECID associated with an invocation of viewPatients:

image

Now we can check what was occurring on the WLS level through the request by simply looking at the events in the log. First enable all event types in the Event Type view. Next move over to the Log tab:

image

Lastly, let’s check what was happening with the other available events occurring in the same thread during the same time as these high level WLS events. First select all the events in the log (in the Operative Set) (ctrl-A). Next right click and select add concurrent:
image

You will now see related events such as allocations and exceptions popping up:

image

The other tabs in the Events tab group can of course be used with the new operative set as usual. For example, to get a graphic overview of all the events involved in the request, go to the Graph tab:

image

Summary

The Operative Set is a feature that allows power users of Mission Control to look at events from different angles and quickly home in on related events having certain properties. It is a power user feature – it may take a little bit of getting used to, but once you’re used to it you’ll be scary effective. Blinkar

My JMC is Hungry!

I just realized that I could not open my favourite example recordings using the standard settings included in JMC. It seems sometimes the heuristics for the default max heap size on the 32-bit HotSpot JVM results in a relatively modest value. So, if you are seeing this a lot…

image

…the next step would be to try to get JMC a bit more memory. The easiest way to do this is to simply edit the jmc.ini file, which is located next to the jmc launcher in the bin folder of the JDK. It will typically look something like this:

-startup
../lib/missioncontrol/plugins/org.eclipse.equinox.launcher_1.3.0.v20120522-1813.jar
--launcher.library
../lib/missioncontrol/plugins/org.eclipse.equinox.launcher.win32.win32.x86_1.1.200.v20120913-144807
-vm
./javaw.exe
-vmargs
-XX:+UseG1GC
-XX:+UnlockCommercialFeatures
-XX:+FlightRecorder
-Djava.net.preferIPv4Stack=true


What you would typically want next is to set the max heap and initial heap to the same, and to as much as you can possibly afford. On my tiny laptop, maybe something like a gig or so:

-startup
../lib/missioncontrol/plugins/org.eclipse.equinox.launcher_1.3.0.v20120522-1813.jar
--launcher.library
../lib/missioncontrol/plugins/org.eclipse.equinox.launcher.win32.win32.x86_1.1.200.v20120913-144807
-vm
./javaw.exe
-vmargs
-XX:+UseG1GC
-Xmx1024m
-Xms1024m
-XX:+UnlockCommercialFeatures
-XX:+FlightRecorder
-Djava.net.preferIPv4Stack=true

Native Memory Tracking in 7u40

Since we don’t have any nice NMT (Native Memory Tracking) MBean in HotSpot (yet), and therefore not in the JMC console, I thought I’d show how it can be done using command line arguments and JCMD. Please note that you’ll get a 5-10% performance hit if you enable this.

Step 1 – Enabling NMT

This is done by using the following command line:

-XX:NativeMemoryTracking=[off|summary|detail]

Where the different options are:

off NMT is turned off. This is the default.
summary Only collect memory usage aggregated by subsystem.
detail Collect memory usage by individual call sites.


Again, note that enabling this will cause you a 5-10% overhead.


Step 2 – Using JCMD to Access the Data

To use JCMD to dump the data collected thus far, and to optionally compare it to the last baseline, use the following command:

jcmd <pid> VM.native_memory [summary | detail | baseline | summary.diff | detail.diff | shutdown] [scale= KB | MB | GB]

summary Print a summary aggregated by category.
detail
  • Print memory usage aggregated by category
  • Print virtual memory map
  • Print memory usage aggregated by call site
baseline Create a new memory usage snapshot to diff against.
summary.diff Print a new summary report against the last baseline.
detail.diff Print a new detail report against the last baseline.
shutdown Shutdown NMT.


Here is a table with the different memory categories (this may change):

Category

Description

Java Heap

The heap. This is where your objects live.

Class

Class meta data.

Code

Generated code.

GC

Data use by the GC, such as card table.

Compiler

Memory used by the compiler when generating code.

Symbol

Symbols.

Memory Tracking

Memory used by the NMT itself.

Pooled Free Chunks

Memory used by chunks in the arena chunk pool.

Shared space for classes

Memory mapped to class data sharing archive.

Thread

Memory used by threads, including thread data structure, resource area and handle area, etc.

Thread stack

Thread stack. It is marked as committed memory, but it might not be completely committed by the OS.

Internal

Memory which does not fit the above categories, such as the memory used by the command line parser, JVMTI, properties, etc.

Unknown

When memory category can not be determined.

  • Arena: when arena is used as stack or value object
  • Virtual Memory: when type information has not yet arrived


Additional Options

Use the following NMT options to print a report on VM exit:

-XX:+PrintNMTStatistics -XX:+UnlockDiagnosticVMOptions

NMT will shut itself down when it detects low resource conditions, such as when running low on native memory. Sometimes that may be the situation when you would really want the data! This is the flag to disable auto shutdown:

-XX:-AutoShutdownNMT

Note that detail level information is not supported on ARM.

Final Thoughts

The information in this blog post mostly comes from a wiki document authored by Zhengyu Gu, who also did the HotSpot implementation. Also, shout out to Fredrik Öhrström who came up with the NMT idea, and who did the original JRockit implementation of it!

Using the Java Discovery Protocol

I just got a question on how to get the Java Discovery protocol up and running, so I though I’d better do a quick blog on it.

First of all you need a 7u40 or later of the HotSpot JDK. Next you need to know how to start the external management agent, since the JDP server follows the life cycle of the external JMX management agent. Since it is getting late, I hereby promise to do a really long blog on how to properly set it up in a secure manner later, and simply show how to ABSOLUTELY NOT do it for now. The following example will open up an agent with absolutely no security and wide access into your JVM with both the RMI Registry and RMI Server at port 7091:

-Dcom.sun.management.jmxremote.port=7091 -Dcom.sun.management.jmxremote.rmi.port=7091 -Dcom.sun.management.jmxremote.authenticate=false -Dcom.sun.management.jmxremote.ssl=false


Now, the next step is to enable JDP. This is simply done by adding the flag:

-Dcom.sun.management.jmxremote.autodiscovery=true


Finally, a nice structured display name can be provided to JDP by setting the name parameter like this:

-Dcom.sun.management.jdp.name=MyCluster/MyJVM


You should see something similar to this:

JDP

Note that there are other parameters that can be used with JDP, such as changing the multicast group, or changing the TTL for wider reach. Please see the command line documentation for further information.


Using JCMD

JDP can also be started when using JCMD to fire up the external management agent. Here is an example:

jcmd 5596 ManagementAgent.start jmxremote.ssl=false jmxremote.port=7091 jmxremote.rmi.port=7091 jmxremote.authenticate=false jmxremote.autodiscovery=true


Where 5596 is the PID of the process for which you want to start up the management agent. Again, do not start up your management agents with all the security turned off. This is just an example.

Unfortunately the name parameter is not available when starting JDP through JCMD. This is a known bug, and it will be fixed in a later version of the JVM.

Allocation Profiling in Java Mission Control

With the Hotspot JDK 7u40 there is a nifty new tool called Java Mission Control. Users of the nifty old tool JRockit Mission Control will recognize a lot of the features. This particular blog entry focuses on how to do allocation profiling with the Java Flight Recorder.

The JVM is a wonderful little piece of virtualization technology that gives you the illusion of an infinite heap. However that comes at a cost. Sometimes the JVM will need to find out exactly what on your heap is in use, and throw the rest away – a so called garbage collection. This is because the physical memory available to the JVM indeed is limited, and memory will have to be reclaimed and reused when it is no longer needed. In timing sensitive applications, such as trading systems and telco applications, such pauses can be quite costly. There are various tuning that can be done for the GC to make it less likely to occur. But I digress. One way to garbage collect less, is of course to allocate less.

Sometimes you may want to find out where the allocation pressure is caused by your application. There are various reasons as to why you may have reached this conclusion. The most common one is probably that the JVM is having to garbage collect more often and/or longer than you think is reasonable.

The JFR Allocation Event

In the Java Flight Recorder implementation in HotSpot 7u40 there are two allocation events that can assist in finding out where the allocations are taking place in your application: the Allocation in new TLAB and the Allocation outside TLAB events.

Just like for most events provided with the HotSpot JDK, there is of course a custom user interface for analyzing this in Mission Control, but before going there I thought we’d take a moment to discuss the actual events.

First you need to make sure they are recorded. If you bring up the default (continuous) template, you will notice that allocation profiling is off by default. Either turn it on, or use the profiling template. The reason it is off by default is that it may produce quite a lot of events, and it is a bit hard to estimate the overhead since it will vary a lot with the particular allocation behaviour of your application.

The Log tab in the Events tab group is an excellent place to look at individual events. Let’s check out what these actually contain:

allocation_outside_tlab

They contain the allocation size of whatever was allocated, the stack trace for what caused the allocation, the class of what was allocated, and time information. In the case of the inside TLAB allocation events, they also contain the size of the TLAB.

Note that we, in the case of the (inside) TLAB allocation events, are not emitting an event for each and every location – that would be way too expensive. We are instead creating an event for the first allocation in a new TLAB. This means that we get a sampling of sorts of the thread local allocations taking place.

Also, note that in JRockit we used to have TLA events that perfectly corresponded to the allocations done in the nursery, and large object allocation events that corresponded to allocation done directly in old space. This is a little bit more complicated in HotSpot. The outside TLAB allocation events can both correspond to allocations done due to an allocation causing a young collection, and the subsequent allocation of the object in the Eden as well as the direct allocation of a humongous object directly in old space. In other words, don’t worry too much if you see the allocation of a few small objects among the outside of TLAB events. Normally these would be very few though, so in practice the distinction is probably not that important.

Using the Allocations Tab

The allocations tab actually consists of three sub tabs:

  1. General
  2. Allocation in new TLAB
  3. Allocation outside TLAB

The General tab provides an overview and some statistics of the available events, such as total memory allocated for the two different event types. Depending on what your overarching goal is (e.g. tuning TLAB size, reducing overall allocation) you may use this information differently. In the example below it would seem prudent to focus on the inside TLAB allocations, as they contribute way more to the total allocation pressure.

allocation_general

The Allocation in new TLAB tab provides three more types of visualization specific to the in new TLAB events: Allocation by Class, Allocation by Thread and Allocation Profile. The Allocation Profile is simply the aggregated stack trace tree for all of the events. In the example below it can be seen that Integer object allocations correspond to almost all the allocations in the system. Selecting the Integer class in the histogram table shows the aggregated stack traces for all the Integer allocations, and in this example all of them originate from the same place, as seen below (click in pictures to show them in full size).

allocation_by_class

The Allocation outside TLAB tab works exactly the same way as the Allocation in new TLAB tab, only this time it is, of course, for the Allocation outside TLAB events:

allocation_outside_tlab2

Limitations

Since the Allocation in new TLAB events only represents a sample of the total thread local allocations, having only one event will say very little about the actual distribution. The more events, the more accurate the picture. Also, if the allocation behaviour vary wildly during the recording, it may be hard to establish a representative picture of the thread local allocations.

Thanks to Nikita Salnikov for requesting this blog entry! Ler

Further reading and useful links

Related Blogs:
Java Mission Control Finally Released
Creating Flight Recordings
My JavaOne 2013 Sessions
Low Overhead Method Profiling with Mission Control

The Mission Control home page:
http://oracle.com/missioncontrol

Mission Control Base update site for Eclipse:
http://download.oracle.com/technology/products/missioncontrol/updatesites/base/5.2.0/eclipse/

Mission Control Experimental update site (Mission Control plug-ins):
http://download.oracle.com/technology/products/missioncontrol/updatesites/experimental/5.2.0/eclipse/

The Mission Control Facebook Community Page (not kidding):
http://www.facebook.com/pages/Java-Mission-Control/275169442493206

Mission Control on Twitter:
@javamissionctrl

Me on Twitter:
@hirt

Creating Flight Recordings

With the Hotspot JDK 7u40 there is a nifty new tool called Java Mission Control. Users of the nifty old tool JRockit Mission Control will recognize a lot of the features. This particular blog entry focuses on the Java Flight Recorder and various ways you can go about to create a flight recording.

In the last blog entry about the method profiler I showed that Mission Control can be quite useful for profiling production systems. However, I only showed one way to produce the actual recording.

There are several different ways to produce a recording, all of them useful in a certain context. But before we get into that, we should first discuss the two different kinds of recordings.

Continuous Recordings

Continuous recordings are not only very hard to spell, they are also very common in production systems. Well, if Java Flight Recorder will be used anything like the JRockit equivalent, at least they will be. Continuous recordings have no end time and will keep recording until the JVM shuts down, or someone tells it to end. This kind of recording can be dumped at any point in time when access to the data being recorded is needed.

Time Fixed Recordings

Also known as profiling recordings, these recordings run for a fixed amount of time and then automatically end themselves. These typically use templates that enable costlier events, since the performance penalty will only be suffered for a limited duration of time.

Note that it is perfectly feasible to have several recordings running in parallel. It is even quite common. Which brings me to the first quirkiness of the Java Flight Recorder: Recordings active at the same time share the same buffers!

It may be easier to consider recordings to be named sets of Event Type settings, i.e. settings of what to record, that are being pushed and popped from the recording engine. At any given time, the union of the settings dictates what will be recorded.

Here is an example:
A continuous recording R0 is started at T0 with settings S0. After a while, a time fixed recording R1 is started at T1 with settings S1, where S1 ⊃ S0. The time fixed recording R1 ends at T2. This is what will be recorded:

Time Settings
T0→T1 S0
T1→T2 S0 ∪ S1
>T2 S0

Note that this means that if you dump the continuous recording R0 for a time range intersecting [T1,T2], you will actually find that you are getting information in your “recording” that you did not ask for in the settings (S0). All this in the name of performance. Blinkar Once T2 arrives, the settings for R1 will be popped, and we’re back to just recording S0.

Now, one last reminder before getting back to the actual recording:

The 1st Rule of Flight Recording*
Thou Shalt Never Forget to Start Your JVM with
-XX:+UnlockCommercialFeatures -XX:+FlightRecorder

RAmen!
(* Only required in HotSpot. With JRockit, no command line flags are required.)

Creating a Recording from Within Mission Control

This is probably the easiest way to produce a recording, since you get help both with connecting to the JVM from which you want the recording, and a nice wizard that helps you to select what to record. I went through the recording wizard in the blog entry about the method profiler, so I will not repeat that here. I will just note that the template settings that you arrive at can be exported from Mission Control, and then stored server side so that anyone connecting to that JVM though Mission Control will have access to it. Simply create a recording with the settings you would like to store, next go to the Template Manager, select the template marked as “ – last saved” and hit Export. Then put the exported file in the jre/lib/jfr folder of the JVM where you want to make the template available.

Creating a Recording Using Command Line Arguments

This is quite useful when you want to record the start up behaviour of an application, or when you want to make sure that your application always starts with a continuous recording running. Since I am a staunch believer of examples, I’ll simply give three examples.

Here is an example of how to start a one minute time fixed recording, 20 seconds after the JVM has started, using the profile template :
-XX:+UnlockCommercialFeatures -XX:+FlightRecorder -XX:StartFlightRecording=delay=20s,duration=60s,name=MyRecording,filename=C:\demo\myrecording.jfr,settings=profile

Note that the settings parameter either takes a path to a template, or the name of a template which must be available in the jre/lib/jfr folder of the JVM.

Here is an example on how to start a continuous recording, using the default template:
-XX:+UnlockCommercialFeatures -XX:+FlightRecorder -XX:StartFlightRecording=name=MyRecording,settings=default

Note that in the second example we do not specify any file name. The data will need to be dumped on request, either using Mission Control or jcmd, or possibly by using the dump-on-exit parameters to make the JVM dump the recording when exiting the JVM, like this:
-XX:+UnlockCommercialFeatures -XX:+FlightRecorder -XX:FlightRecorderOptions=defaultrecording=true,dumponexit=true,dumponexitpath=c:\demo\dumponexit.jfr

For more information on the available parameters, see the Java Command Line Reference.

Creating a Recording Using JCMD

You can also control the Flight Recorder even after you have started the java process (as long as you adhere to the 1st Rule of Flight Recording) using JCMD. The JCMD utility is in the JAVA_HOME/bin folder and allows you to enumerate the locally running Java processes, and send commands to them. Just running jcmd will list the running Java processes and their PIDs:

C:\Java\jmc5.2labs>jcmd
4711 LoadAndDeadlock
1276 sun.tools.jcmd.JCmd

To query a certain JVM for the available commands, use “help”:


C:\Java\jmc5.2labs>jcmd 7484 help
7484:
The following commands are available:
JFR.stop
JFR.start
JFR.dump
JFR.check
VM.native_memory
VM.commercial_features
ManagementAgent.stop
ManagementAgent.start_local
ManagementAgent.start
Thread.print
GC.class_histogram
GC.heap_dump
GC.run_finalization
GC.run
VM.uptime
VM.flags
VM.system_properties
VM.command_line
VM.version
help
For more information about a specific command use 'help <command>'.

Here is an example which starts a continuous recording from the command line using JCMD (assuming that the PID of the Java process you want to record on is 4711):

C:\Java\jmc5.2labs>jcmd 7484 JFR.start name=MyRecording settings=default
4711: Started recording 1. No limit (duration/maxsize/maxage) in use.

Use JFR.dump name=MyRecording filename=FILEPATH to copy recording data to file.

The JFR.check command can be used to check the status of the recordings:

C:\Java\jmc5.2labs>jcmd 4711 JFR.check
4711:
Recording: recording=1 name="MyRecording" (running)

To dump the recording:

C:\Java\jmc5.2labs>jcmd 4711 JFR.dump name=MyRecording filename=C:\demo\jcmddump .jfr
4711:
Dumped recording "MyRecording", 180.3 MB written to:

C:\demo\jcmddump.jfr

Then you can just drag and drop the resulting file into Mission Control to view the contents:

 pretty
(No blog post is complete without a Pretty Picture™.)

Further reading and useful links

Related Blogs:
Java Mission Control Finally Released
My JavaOne 2013 Sessions
Low Overhead Method Profiling with Mission Control

The Mission Control home page:
http://oracle.com/missioncontrol

Mission Control Base update site for Eclipse:
http://download.oracle.com/technology/products/missioncontrol/updatesites/base/5.2.0/eclipse/

Mission Control Experimental update site (Mission Control plug-ins):
http://download.oracle.com/technology/products/missioncontrol/updatesites/experimental/5.2.0/eclipse/

The Mission Control Facebook Community Page (not kidding):
http://www.facebook.com/pages/Java-Mission-Control/275169442493206

Mission Control on Twitter:
@javamissionctrl

Me on Twitter:
@hirt

Low Overhead Method Profiling with Java Mission Control

With the Hotspot JDK 7u40 there is a nifty new tool called Java Mission Control. Users of the nifty old tool JRockit Mission Control will recognize a lot of the features. This blog focuses on the Flight Recorder tool, and the method profiling information you can get from the flight recorder.

So you want to know why all your CPUs are saturated. Perhaps you even want to get some hints as to what changes can be done to your application to make it less CPU-hungry. Don’t despair – Java Mission Control to the rescue!

Built into the HotSpot JVM is something called the Java Flight Recorder. It records a lot of information about/from the JVM runtime, and can be thought of as similar to the Data Flight Recorders you find in modern airplanes. You normally use the Flight Recorder to find out what was happening in your JVM when something went wrong, but it is also a pretty awesome tool for production time profiling. Since Mission Control (using the default templates) normally don’t cause more than a per cent overhead, you can use it on your production server.

Getting the Data

So, to do method profiling with JMC, simply go about producing a recording like you normally would. Here is an example:

  1. Start the application you want to profile with the following arguments to enable the flight recorder:
     -XX:+UnlockCommercialFeatures -XX:+FlightRecorder 
  2. Next start Mission Control. You can just double click on jmc in the bin folder of your 7u40 JDK.
  3. (Close the Welcome screen if this is your first time starting JMC.)
  4. Right click on the JVM you wish to start a flight recording on in the JVM browser and select Start Flight Recording.
    StartFlightRecording
  5. Leave all the default settings and select the ‘Profiling – on server’ template for your Event Settings. You can usually just hit finish at this point, but I’d like to talk a bit on how you can control the method sampler.
  6. Click Next to go to the higher level event settings. These are groupings of named settings in the template. Here you can select how often you want JFR to sample methods by changing the Method Sampling setting.
    MethodSamplingSettings
  7. If this level of granularity is not enough, you can click next and modify the event settings on a per event type basis. Type Method in the filter text box.
    MethodSamplingAdvanced
    Note that you can go back and forth between the previous wizard page to find out what the high level settings really represent.
  8. When satisfied, click finished. The recording will be downloaded automatically and displayed in Mission Control. Click the tab group for Code to start visualizing your Method Profiling Sample events.
    SpecJBBMethodOverview
    (Since Java 2D hardly produces any load on my machine, I actually switched to a SpecJBB recording here. Blinkar )
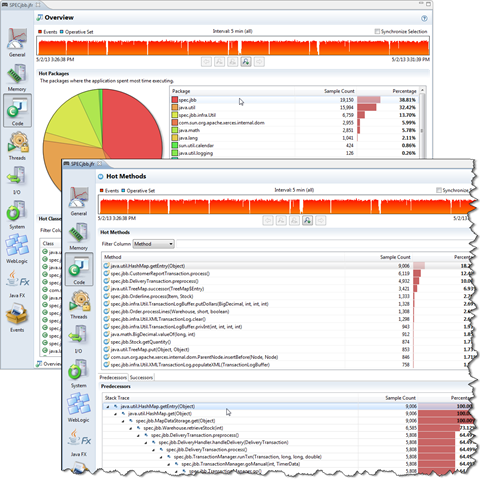
    On this tab you get a overview breakdown of where the JVM is spending the most time executing your application.
  9. Switch to the method profiling tab to find a top list of the hottest methods in your application.
    image
    The top ones are usually a good place to start optimizing.

Optimization

Once you’ve found your top methods, you either want to make sure that these methods are faster to execute, or that you call the method less. To find out how to call the method less, you normally look for ways to call along the predecessor stack traces less, and you look for the closest frame that you can change. It is quite common that the case is that some JDK core class and method is among the top methods.

Since you cannot rewrite, say, HashMap.getEntry(), you need to search along the path for something that you can change/control. In my recording, the next one is HashMap.get(), which does not help much. The next one after that might be a good candidate for optimization. An alternative would be to find somewhere along the entire path where we can reduce the number of times we need to call down to get whatever we need to get from the HashMap.

After you’ve done your optimizations you do a new recording to see if something else has popped up to the top. Notice that it really doesn’t matter exactly how much faster the method itself became. The only interesting characteristic is the relative time you spend executing that part of the Java code. It gives you a rough estimate of the maximum performance gain you can get from optimizing that method.

Command Line Flags

Aside from the normal command line flags to control the FlightRecorder (see this blog), there are some flags that are especially useful in the context of the method sampling events.

There is one flag you can use to control whether the method profiler should be available at all:

-XX:FlightRecorderOptions=samplethreads=[true|false]

There is also a flag to limit the stack depth for the stack traces. This is a performance optimization and a safety, so that the performance hit doesn’t run away, say if you have an insane stack depth and a lot of deep recursive calls. I believe it is set to 64 by default:

-XX:FlightRecorderOptions=stackdepth=<the wanted stack depth>

Limitations

The Flight Recorder method profiler is quite good at describing where the JVM is spending the the most time executing Java code at a very low overhead. There are, however, some limitations/caveats that can be useful to know about:

  1. If you have no CPU load, do not care too much about what the method profiling information tells you. You will get way fewer sample points, not to mention that the application may behave quite differently under load. Now, should your application be under heavy load and you still aren’t saturating the CPU, you should probably go check your latency events.
  2. The method profiler will not show you, or care about, time spent in native. If you happen to have a very low JVM generated CPU load and a high machine CPU load in your recording, you may be spending quite a lot of time in some native library.

Further reading and useful links

Related Blogs:
Java Mission Control Finally Released
My JavaOne 2013 Sessions

The Mission Control home page:
http://oracle.com/missioncontrol

Mission Control Base update site for Eclipse:
http://download.oracle.com/technology/products/missioncontrol/updatesites/base/5.2.0/eclipse/

Mission Control Experimental update site (Mission Control plug-ins):
http://download.oracle.com/technology/products/missioncontrol/updatesites/experimental/5.2.0/eclipse/

The Mission Control Facebook Community Page (not kidding):
http://www.facebook.com/pages/Java-Mission-Control/275169442493206

Mission Control on Twitter:
@javamissionctrl

Me on Twitter:
@hirt

My JavaOne 2013 Sessions

Now that Mission Control has finally been released, it will be way less frustrating to attend JavaOne! 🙂179481-j1-sf-imspeaking-125x125-1946241

Here are the sessions I am involved with this year:

Monday, 23rd
Time Room Title Abstract Type
11:30 – 12:30 Hilton San Francisco – Yosemite A Production-Time Profiling Out of the Box If you’ve installed the latest JDK 7 update, you’ve probably noticed that there is a new item on your start menu. This session discusses the latest addition to Oracle’s HotSpot JDK: Oracle Java Mission Control, a tool suite for low-overhead production-time profiling and diagnostics that originated with the JRockit JVM. As part of the convergence between the HotSpot and Oracle JRockit JVMs, Oracle Java Mission Control is now available in the HotSpot JDK. This session • Shows where we are in the JVM convergence effort • Explains what to expect from this first public version of Oracle Java Mission Control on HotSpot • Shows how to get started with Oracle Java Mission Control • Shows some experimental tooling available as plug-ins for Oracle Java Mission Control Conference Session (CON5113)
17:30 – 18:15 Hilton – Imperial Ballroom B Serviceability BOF This BOF session provides an opportunity to talk to HotSpot engineers about the various serviceability technologies available in Oracle’s HotSpot JDK. The technologies include Java Mission Control, JMX, Java Command (jcmd), attach, the Java Discovery Protocol (JDP), the Serviceability Agent, and more. If there are no questions, the engineers are very likely to start demonstrating favorite technologies and tips and tricks. BOF (BOF5376)
Tuesday, 24th
Time Room Title Abstract Type
10:00 – 12:00 Hilton – Continental Ballroom 1/2/3 Java Flight Recorder Deep Dive Detailed information about the new JDK7u40 feature of awesomeness. Tutorial (TUT5181)

Also, don’t miss Staffan Larsen’s talk on the JFR implementation in the HotSpot JVM –
Java Flight Recorder Behind the Scenes [CON5091]

Looking forward to seeing you at JavaOne! 🙂

Java Mission Control (Finally) Released!

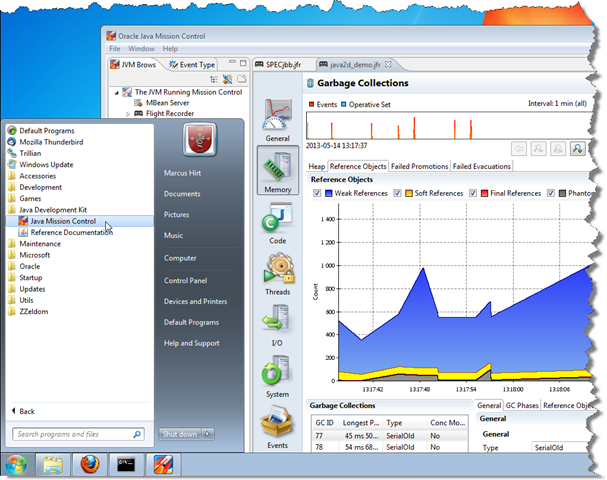
If you’ve had the time to download the latest Java 7 JDK update (7u40), you may have noticed that there is a new addition to the tools in the bin folder: Java Mission Control!

Java Mission Control is a production time tools suite that has its roots in the JRockit JVM tooling. This is the Mission Control team’s first public release in a couple of years, so we’re obviously quite excited! That said, the 5.2.0 version number is really a bit misleading – for most purposes and intent this is really a 1.0.0 release. Please have some patience as we bring Mission Control fully to par with what JRockit offered. Meanwhile I hope you find it as useful as I do!

I will be talking more about Java Mission Control in blogs later this week, but in this one I just thought I’d just do my own version of the release notes. Here goes:


General


Now part of the Hotspot JDK!
This is the first release of Java Mission Control that is bundled with the Hotspot JDK! The convergence project between JRockit and Hotspot has reached critical mass. With the 7u40 release of the Hotspot JDK the information available from HotSpot is equivalent to that of JRockit. This doesn’t necessarily mean that all events are exactly the same – the JRockit and HotSpot JVM implementations are quite different. It does mean, however, that the set of events available from HotSpot contains more than enough to be quite useful.

jdk

New JVM Browser
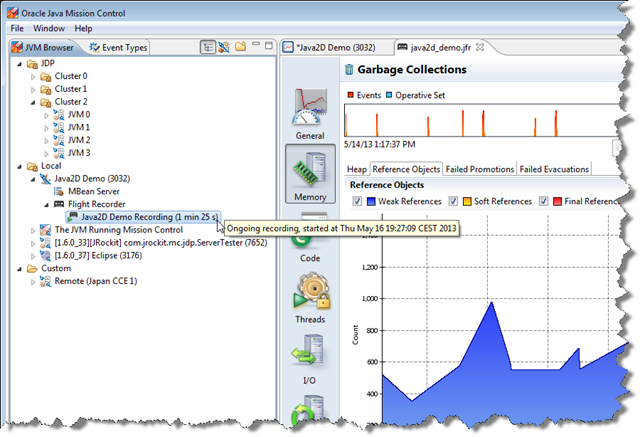
The JVM Browser now have sub-nodes for server side services available. The sub-nodes can show the state of the service. For instance, the Flight Recorder service will, if expanded, show what recordings are running on the server, if any. It also provides improved drag and drop behaviour, as the default action for each service will be invoked when the service is dragged to the editor area (or double clicked). The new JVM Browser can be viewed in two different modes – as a flat list, and as a tree. The flat list is useful when you are only working with local JVMs. The tree view makes it easier to keep track of JVMs discovered from multiple different sources, such as JDP-discovered JVMs, custom created remote connections, and local JVMs.

browser

Eclipse 3.8/4.2 support
Mission Control can now be installed in the Eclipse 3.8.2/4.2.2 IDE. There is also an update site for experimental plug-ins.

eclipse

Note: Unfortunately JMC 5.2.0 will not install in Eclipse 4.3.x or later (fixed in the upcoming 5.3.0 release of Mission Control). Also, note that the performance issues in the 4.x branch of Eclipse makes JMC quite a lot slower to work with in Eclipse 4.x compared to Eclipse 3.8. With some luck, this will improve in the upcoming 4.3.2 version of Eclipse. The stand alone version of JMC is built on 3.8.2 and is not affected.

Minor bug fixes and improvements
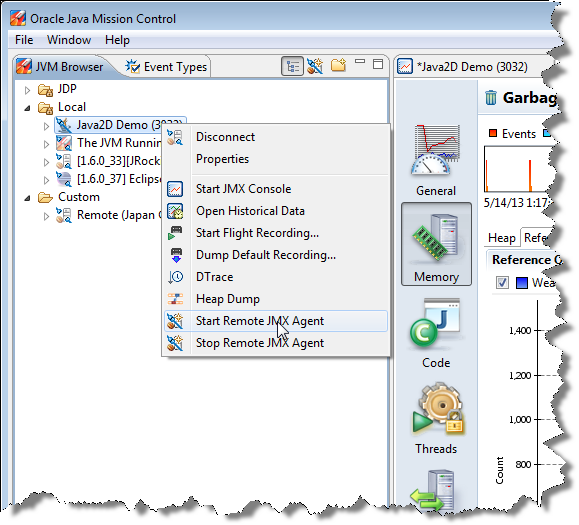
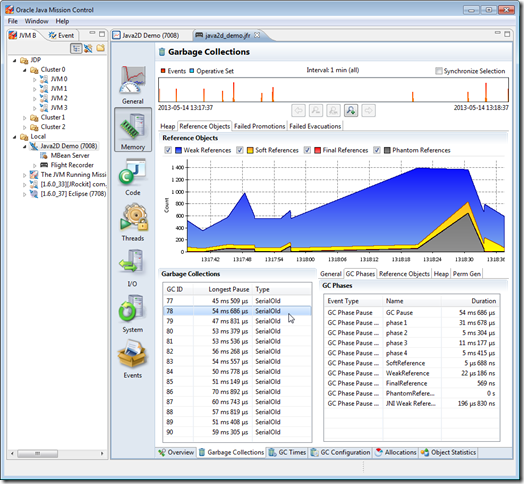
There are hundreds of minor fixes and improvements in this release. For example: Configurable encryption for the secure password store and support for the Hotspot version of JDP (Java Discovery Protocol, used to detect running JMX agents). There is also an action available now to start the external management agent on a locally running JVM.

startremote


Management Console


Improved MBean Browser
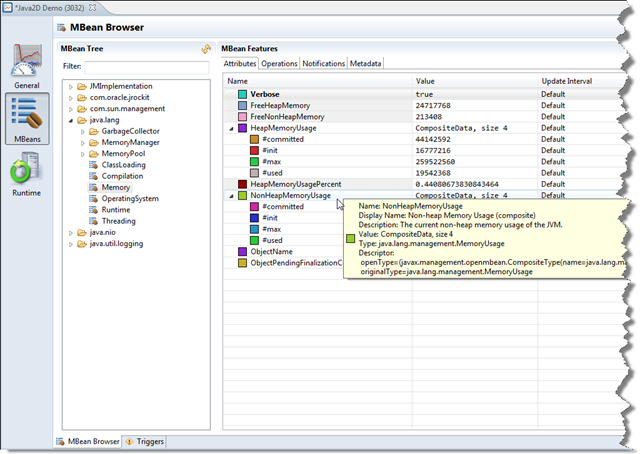
It is now possible to edit values for settable attributes directly in the attribute tree. Synthetic attributes (virtual attributes that are contributed through an extension point and calculated on the client side, possibly using server side values) now have a greyish background in the Name column. Column visibility can now be changed by right-clicking on a column header. The results of invoking multiple consecutive operations are now shown in the results section. Notifications in the notifications tab can now be arbitrarily expanded, just like attributes in the attributes tree. It is also possible to subscribe to multiple notifications at the same time.

browser

Coherence plug-in
The Coherence plug-in has seen numerous bug-fixes and resource optimizations. To install it into the stand alone version of Mission Control, go to Help | Install plug-ins… on the menu. To install it into Eclipse, first install the Eclipse plug-in version of Mission Control, then install it from the Experimental update-site.


Java Flight Recorder (JFR)


Event Convergence with JRockit
Hotspot has now reached event convergence with JRockit. That means that most useful information that was provided from JRockit is now also available from Hotspot. That said, JRockit and Hotspot are quite different JVMs; the information will in some cases be a bit different. That said, you can still profile most application with less than 2% overhead. Usually much less. Which, considering the information you get, is next to nothing.

jfr

Method profiling
There are now method profiling events! With the method profiling events you can find out where your application is spending the most time executing your Java code. This is, for instance, useful to optimize the application where the optimizations actually have an impact.

methodprofiling

Allocation profiling
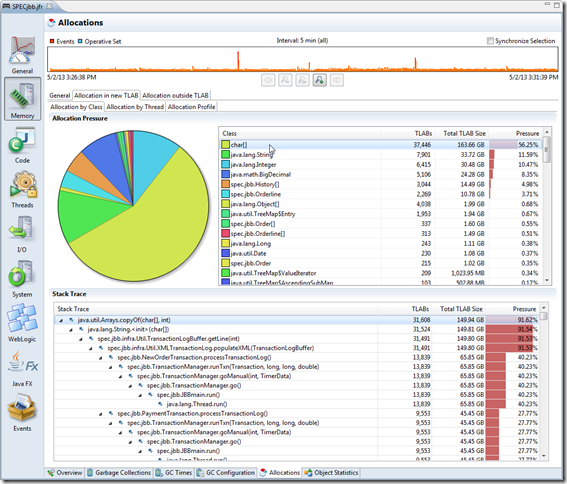
The allocation profiling tab has been improved. You can see per TLAB allocation with traces, and object being allocated directly in old space.

allocationprofiling

New and improved tabs
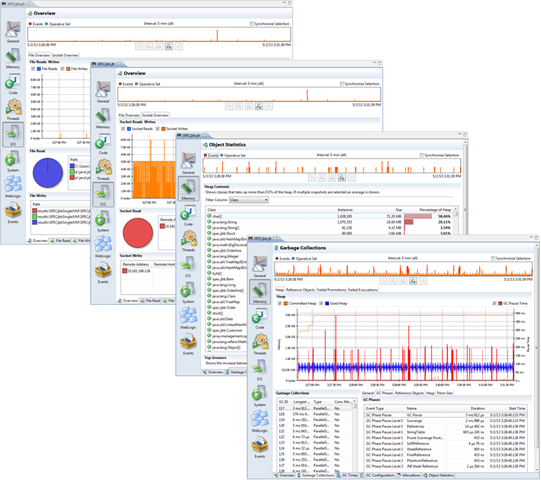
All tabs in the Flight Recorder have gotten a major overhaul. Some worth mentioning are, for example, the File I/O, Socket I/O, Compiler, Exception and GC tabs. Details and screenshots for all these changes would make for a very long New and Noteworthy – instead I encourage you to try them out!

newtabs

Latency analysis
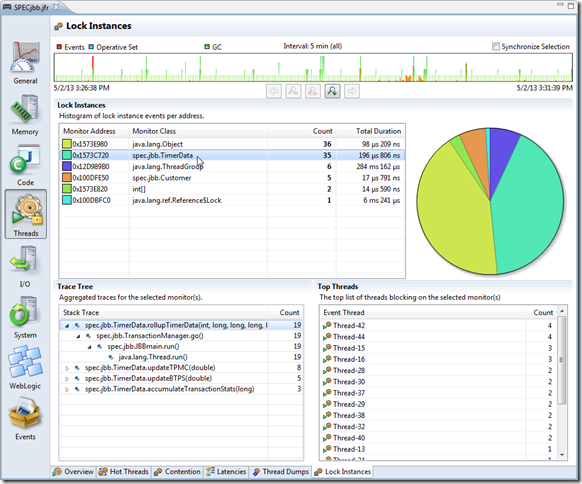
Sometimes you may wonder why the CPU never saturates, no matter how much load you generate for your app. Everything just starts going slower. The Flight Recorder records your thread stalls so that you can find out why. In this version you can look at individual monitor instances.

lockinstances

Thread graph
The thread graph is useful for getting an overview of what threads are running and what they are doing. Minor fixes in this version include better time stamps on the time line.

threadgraph

New Templates
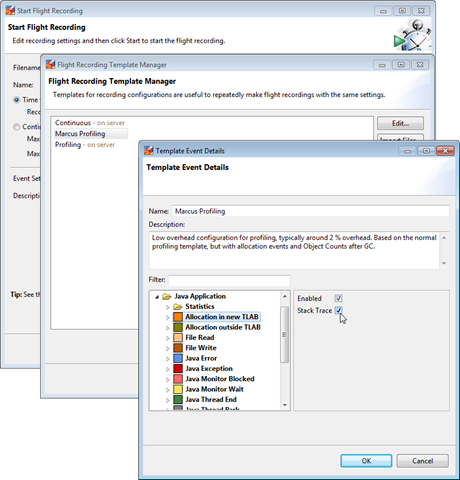
Previously you needed to know exactly what event types to configure when you wanted to change the recording settings. Now there is instead an easy to use configuration step in the templates where you will find the most useful settings. For instance, you can change how often method samples to record (Low, Medium, High), instead of needing to know exactly what event types to configure. You can still, of course, do the per Event Type fiddling if you would like to. Also, the client and server side template formats are the same, so you can export your templates from the client, and use them on the server.

newtemplates

Template Manager
There is also a new template manager to go with the new templates!

templatemanager


Experimental Plug-ins


JOverflow – Heap dump analysis for memory waste
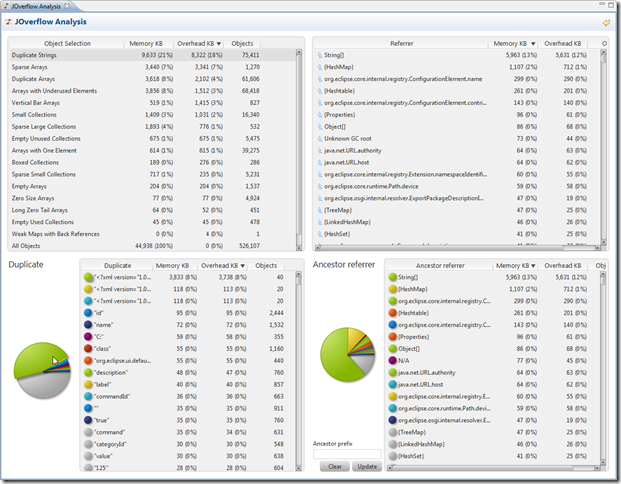
This plug-in allows Mission Control to do heap dump analysis, primarily to look for wasted heap space. There are several different anti-patterns JOverflow will look for, such as duplicate strings, underutilized collections etc. This plug-in also adds an action (for local connections) that will perform a heap dump and then visualize the heap dump with JOverflow.

joverflow

DTrace plug-in improvements
There has been a lot of bug fixes and improvements to the DTrace plug-in. The DTrace plug-in for Mission Control is available from the update site. To install it into the stand alone version of Mission Control, go to Help | Install New Software… on the menu. To install it into Eclipse, first install the Eclipse plug-in version of Mission Control, then install it from the Experimental update-site. The improvements to the plug-in include: improved error handling and error reporting, improved documentation, faster wizard start-up and miscellaneous bug-fixes. I’ve written a blog on the experimental D-Trace plug-in that contains some more information.

dtrace


Memleak


Not available (yet)!
If you are a JRockit Mission Control user, you will probably go look for the on-line heap analyser called Memleak. Well, the convergence between JRockit and Hotspot is not quite complete yet. We do however provide a useful heap dump analysis tool called JOverflow. More information above.

memleak


Further reading and useful links

The Mission Control home page: 
http://oracle.com/missioncontrol

Mission Control Base update site for Eclipse:
http://download.oracle.com/technology/products/missioncontrol/updatesites/base/5.2.0/eclipse/

Mission Control Experimental update site (Mission Control plug-ins):
http://download.oracle.com/technology/products/missioncontrol/updatesites/experimental/5.2.0/eclipse/

The Mission Control Facebook Community Page (not kidding):
http://www.facebook.com/pages/Java-Mission-Control/275169442493206

Mission Control on Twitter:
@javamissionctrl

Me on Twitter:
@hirt