
There is a downloadable plug-in for Mission Control which adds DTrace support to Mission Control. It can be used to record running Java processes with highly detailed information from the underlying platform. It can also be highly customized and configured to record your own probes. It does so with a twist; for the recorded data to be the most useful, it needs to be in a self describing format that can easily be consumed by a client. Therefore Mission Control adds a few capabilities to DScript and, if installed into Eclipse from the eclipse update site, adds editing functionality of dscript files with the new syntax.
Together with the capability to quickly build your own user interface for the new probes, from within Mission Control itself, the DTrace plug-in provides quite powerful functionality for the platforms where DTrace exist.
Quick Overview
|
The DTrace plug-in lets you go from editing your self describing DTrace events… |
…via DTrace execution on the server… | …to the DTrace data visualized in Mission Control! |
 |
 |
 |
Installing Mission Control & the DTrace Plug-in
If you are an Oracle employee, you should be using the latest builds of Java Mission Control 5.2. Contact me if you need information on how to get builds. If you are not, there is an early version of the DTrace plug-in available in JRockit Mission Control 4.1.
No matter which version you use, you have the choice to either use the stand alone version of Mission Control, or the Eclipse version. For DTrace they both have their own distinct advantages: the stand alone version provides easy access to the built in GUI editor, and the Eclipse version has nice editor support for the special DScript Event syntax.
For the stand alone version:
- Download JRockit: http://www.oracle.com/technetwork/middleware/jrockit/downloads/index.html
Note that the client were not built for Solaris in the good old JRockit days, so be prepared to install the client on one of the other platforms. You can also try installing the plug-ins into an Eclipse. If you are an Oracle Employee, and you’re using Java Mission Control 5.2, there are builds for most platforms. - Install the DTrace plug-in by selecting Help->Install Plug-ins, and then selecting the plugins under DTrace Recorder.
For the Eclipse version:
- Install Mission Control from the following update site: http://download.oracle.com/technology/products/missioncontrol/updatesites/base/4.1.0/eclipse/
- Install the DTrace Recorder plug-ins from the following update site: http://download.oracle.com/technology/products/missioncontrol/updatesites/experimental/4.1.0/eclipse/
Using the Plug-in As Is
After installing Mission Control and the DTrace plug-in, open the Help in Mission Control, or in Eclipse. Navigate to the Using the DTrace Recorder chapter. It will tell you all that is needed for basic use of the DTrace Recorder plug-in. Really, the documentation is quite good, and I would recommend taking a break here and go read it before proceeding. ![]()
Adding Your Own Probes
This is most easily done if you have installed Mission Control and the DTrace plug-in into Eclipse. After installing and running a DTrace recording, a sample .de script file will be available to you, as explained in the documentation. A .de file is a dscript file embellished with our own syntax for creating self describing events. A .de file, together with the user input provided in the recording wizard, will be compiled into an ordinary dscript file.
The anatomy of the new .de script files are:
- The Parameters
- The Templates
- Event Declarations
- Probes
Parameters
The parameters are user defined parameters that will be presented to the user when a recording is started. Some are treated special by Mission Control and will be filled out by the framework. In the parameters section the meta data for the parameters are specified. Check out how the objectAllocationCutoff parameter is used in the Template for actual parameter use. Here is an example of a parameter metadata declaration:
@name = "Allocation Block Size"
@type = "memory"
parameter objectAllocationCutoff;
The name annotation is the user friendly name that will be presented to a user of the parameter in the recording wizard. The type decides how input and rendering will be handled. The parameter keyword declares the parameter.
Templates
The template section declares the different templates the user can choose from. It declares which parameters will be available, and which probesets the user will be able to turn on and off. The following snippets show the standard profiling template provided with the plug-in:
@name ="Hotspot Profiling JDK6/JDK7";
template hotspotProfiling
{
    parameter processIdentifier (application = "java*");
    parameter objectAllocationCutoff(min = 1, value = 4096, max = 200000000);

    probeset Allocation (enabled = true);
    probeset ClassLoading (enabled = true);
    probeset GC (enabled = true);
    probeset IO (enabled = true);
    probeset JVMLocks (enabled = true);
    probeset JVMCompilation (enabled = true);
    probeset JVMOperations (enabled = true);
    probeset JavaLocks (enabled = true);
    probeset Paging (enabled = true);
    probeset Scheduling (enabled = true);
    probeset SystemCalls (enabled = true);
};
The template shows that the user will be able to choose processes with java in its application name. It also defines the range for the object allocation cutoff and a set of probesets that the user can select from, all of which be enabled by default.
A probe set is just what it sounds like – a set of probes that will be handled by the template as a group. A probeset is simply a listing of all the probes it includes:
@name ="Scheduling";
@description = "Records thread related information.";
probeset Scheduling
{
    probe cpu_on;
    probe cpu_off;
    probe cpu_exit;
    probe changed_priority;
    probe thread_start;
    probe thread_stop;
    probe thread_park_begin;
    probe thread_park_end;
    probe thread_unpark;
    probe thread_sleep_begin;
    probe thread_sleep_end;
    probe thread_yield;
    probe thread_migration;
};
Event Declarations
To be able to make sense of the events we emit, we need to set up some metadata to associate with them. The metadata includes the path to the event type, the user friendly name, the preferred color to render the events in, and the data fields used. This is an example on how to declare an event:
@name = "Running Thread";
@color = rgb(50, 255, 50);
@path = "Operating_System/Thread/Running";
event ThreadRunning
{
    @name ="Thread Name";
    string threadName;

    @name = "Thread";
    @description = "The thread the event occured in.";
    @type = "thread";
    int thread;
};
Note that, to help Mission Control make the most out of your data, it is quite useful to specify the content type with the @type annotation. There are often a lot of metadata that can be shared between different events. To help with that, there is a mixin keyword to specify metadata that can be shared. You can then use the extends keywork to import that data into your declaration, like this:
mixin Threadable
{
    @name = "Thread";
    @description = "The thread the event occured in.";
    @type = "thread";
    int thread;
};
...
@name = "Java Blocked";
@description = "Blocked on a Java monitor";
@color = rgb(255, 109, 100);
@path = "Java_Application/Monitor_Blocked";
event JavaMonitorBlocked extends Threadable, ClassLockable
{
};
Note, that when editing these files in Eclipse, you have editor support with full syntax highlighting. You can also use ctrl (command on Mac) clicks to jump around in the source, like this:

Probes
The final section is the probes. These are quite like dscript probes, with the important difference that the emit keyword is used for emitting data. Here is an example:
probe read_io
syscall::*read:entry
/ pid == $processIdentifier /
{
    emit IORead(thread = tid, size = arg2);
}
It is also possible to pair events together to form duration events, using the begin and end keywords:
probe syscall_entry
syscall:::entry
/ pid == $processIdentifier /
{
    begin SystemCall(thread = tid, function = probefunc);
}

probe syscall
syscall:::
/ pid == $processIdentifier /
{
    end SystemCall(thread = tid, function = probefunc);
}
Note that the pairing is done by matching up the arguments.
Adding Your Own GUI
Mission Control has a built in GUI designer that allows you to redesign the GUI from within itself. Since the designer is somewhat tricky to use, it is not yet supported. However, if you can live with the quirks, it is quite useful. You can, for instance, easily build a custom user interface for your own events.
First you need to get into open the design view.
For JRockit Mission Control 4.1, this is most easily done from within the stand alone (RCP) version of the tool. This is how you enable it:
- Start JAVA_HOME/bin/jmc
- Press ctrl-1. The Commands view should open.
- In the Commands View, type enabledesignview, and press the play icon.
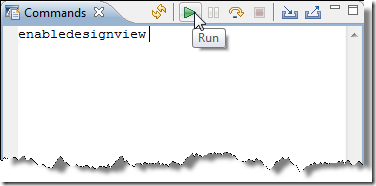
- The Designer View should open.

In late builds of Java Mission Control 5.2, this is simply done by selecting the Window->Show View->Designer menu. The designer view will control all the editing of your tabs, as well as control what tabgroups and tabs are available. It is also from the design view that you export your custom tabs as plug-ins. Now, the first quirk is:
You Must Prime Your Design View!
You prime it by loading a recording with the events that you want to build GUIs for. When you have loaded a recording, however, you cannot change the tabgroups or what tabs are available. So, if you want to add or remove tab groups or tabs, you normally directly close your newly opened recording. Yes. Quirk.
Designer view after opening recording:

Designer view after closing recording:

Now, to add a new tab group, you simply right click on the top node, and select New->New Group from the context menu. Add icons accordingly. If you want to change the relative position of your group, you can add a Placement Path. The Placement Path is a string that will be lexically compared with other strings to determine the position of the group. A placement path starting with ~ (tilde) is typically used to put a tab group towards the end.
To add a tab, simply right click on the tab group node, and select New->Tab.
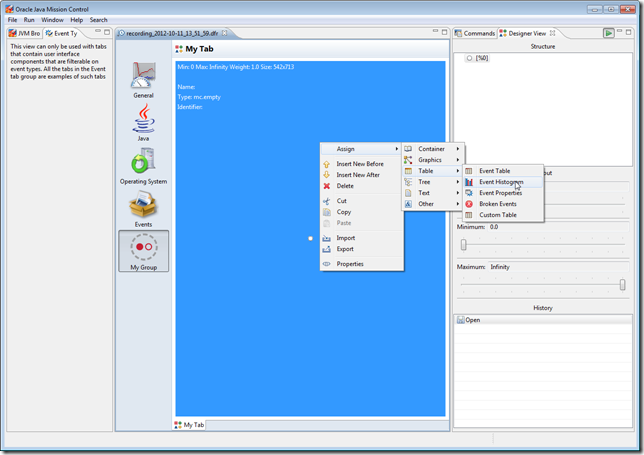
To edit your tab, load the recording containing the events for which you want to build a GUI, then press the stop button in the upper right corner of the Designer View. This will stop the GUI for that tab, and allow it to be edited. Assign components as required. For example, to add an event histogram:
- Right click on the empty area, and select Assign->Table->Event Histogram:
- Fill out an identifier (anything that helps you remember the component later)
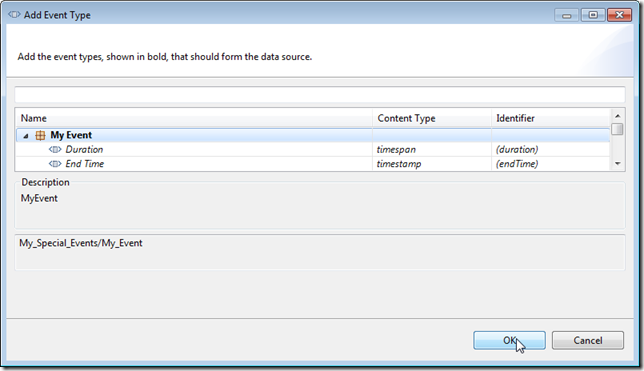
- Go to the Columns tab and press the Browse button, then browse button again, and select your event:
- Next click Group By and hit the Browse button. Select the attribute in your event that you want to group by:
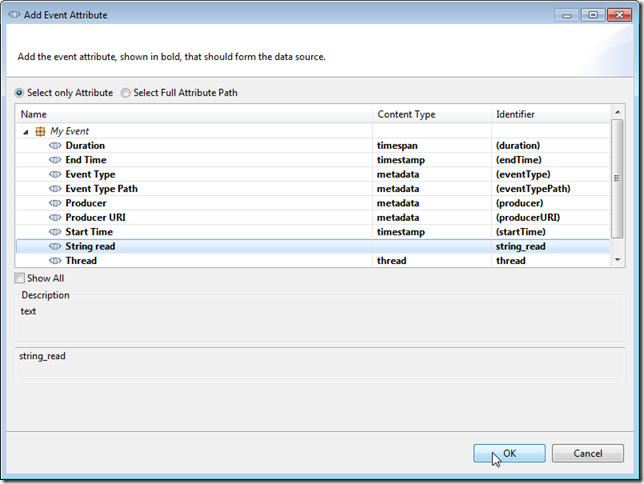
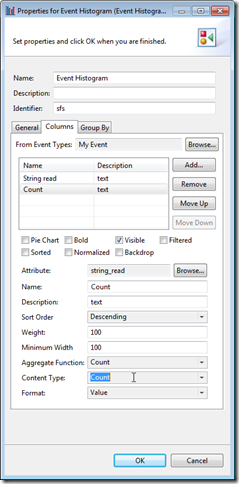
- Next add the columns you want in the table, by pressing add and selecting the attributes. For histograms, having the group by attribute first usually makes sense. You can easily make an event count field, by selecting any attribute, and then selecting Aggregation Function and Content Type to Count:
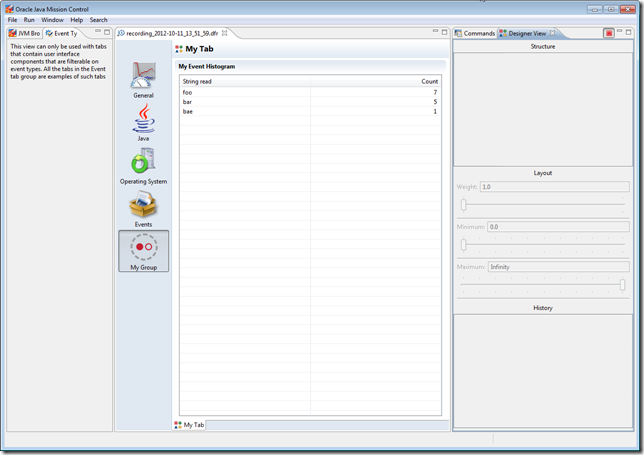
- Press play in the upper right corner to see your working user interface:


Next you may want to store your new GUI as a plug-in, so that it can be shared with other users. This is easily done like this:
- Close your recording.
- Right click on the top node, and select Export UI to Plug-In.
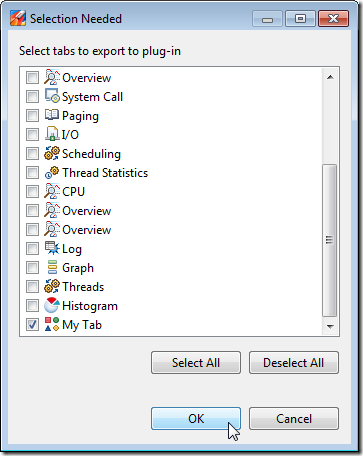
- Next select the tab to export. Note that you usually just want to export your own additions:
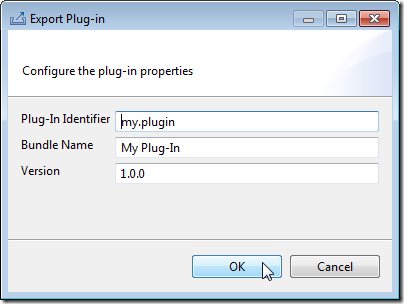
- Next select plug-in properties, such as the name and version. Note that higher versions of your plug-in will override older versions:
- Finally select where it should be saved. Once exported, you can place the resulting jar file in the plug-in folder of another Mission Control to enjoy your user interface there.


That’s it! Have fun, and please let me know if you find this to be useful functionality that you would like the Mission Control team to continue to improve upon!
Big thanks to Klara Ward (@klaraward), the DTrace plug-in maintainer, for the help on this blog-post!
[…] improved documentation, faster wizard start-up and miscellaneous bug-fixes. I’ve written a blog on the experimental D-Trace plug-in that contains some more […]
Hi Marcus,
Installed the Mission Control DTrace Plug-in successfully from Update Site. But while trying to record a session using DTrace Recorder got the below exception. Have enabled permission in jmxremote.access file available in JDK path /jre/lib/management/
monitorRole readonly
controlRole readwrite \
create com.sun.management.*,com.oracle.jrockit.* \
unregister
I am using JMC version 5.2 windows 64 bit
JDK 1.7.0_45
com.jrockit.mc.dtrace.recorder.DTraceRecorderException: Remote machine not setup correctly for running DTrace.
at com.jrockit.mc.dtrace.recorder.Factory.createRemoteDTraceRecorder(Factory.java:70)
at com.jrockit.mc.dtrace.ui.DTraceStartJob.createRemoteRecorder(DTraceStartJob.java:112)
at com.jrockit.mc.dtrace.ui.DTraceStartJob.startRemote(DTraceStartJob.java:79)
at com.jrockit.mc.dtrace.ui.DTraceStartJob.run(DTraceStartJob.java:60)
at org.eclipse.core.internal.jobs.Worker.run(Worker.java:54)
Caused by: java.lang.RuntimeException: Could not invoke operation SetupState on DTraceMBean
at com.jrockit.mc.dtrace.recorder.internal.remote.MBeanToolkit.rethrowBadInvoke(MBeanToolkit.java:85)
at com.jrockit.mc.dtrace.recorder.internal.remote.MBeanToolkit.invokeOperation(MBeanToolkit.java:62)
at com.jrockit.mc.dtrace.recorder.internal.remote.RemoteRecorder.getSetupState(RemoteRecorder.java:95)
at com.jrockit.mc.dtrace.recorder.Factory.createRemoteDTraceRecorder(Factory.java:63)
… 4 more
Caused by: javax.management.InstanceNotFoundException: com.oracle.management:type=DTrace
at com.sun.jmx.interceptor.DefaultMBeanServerInterceptor.getMBean(DefaultMBeanServerInterceptor.java:1095)
at com.sun.jmx.interceptor.DefaultMBeanServerInterceptor.getAttribute(DefaultMBeanServerInterceptor.java:643)
at com.sun.jmx.mbeanserver.JmxMBeanServer.getAttribute(JmxMBeanServer.java:678)
at javax.management.remote.rmi.RMIConnectionImpl.doOperation(RMIConnectionImpl.java:1464)
at javax.management.remote.rmi.RMIConnectionImpl.access$300(RMIConnectionImpl.java:97)
at javax.management.remote.rmi.RMIConnectionImpl$PrivilegedOperation.run(RMIConnectionImpl.java:1328)
at javax.management.remote.rmi.RMIConnectionImpl.doPrivilegedOperation(RMIConnectionImpl.java:1420)
at javax.management.remote.rmi.RMIConnectionImpl.getAttribute(RMIConnectionImpl.java:657)
at sun.reflect.GeneratedMethodAccessor95.invoke(Unknown Source)
at sun.reflect.DelegatingMethodAccessorImpl.invoke(DelegatingMethodAccessorImpl.java:43)
at java.lang.reflect.Method.invoke(Method.java:606)
at sun.rmi.server.UnicastServerRef.dispatch(UnicastServerRef.java:322)
at sun.rmi.transport.Transport$1.run(Transport.java:177)
at sun.rmi.transport.Transport$1.run(Transport.java:174)
at java.security.AccessController.doPrivileged(Native Method)
at sun.rmi.transport.Transport.serviceCall(Transport.java:173)
at sun.rmi.transport.tcp.TCPTransport.handleMessages(TCPTransport.java:556)
at sun.rmi.transport.tcp.TCPTransport$ConnectionHandler.run0(TCPTransport.java:811)
at sun.rmi.transport.tcp.TCPTransport$ConnectionHandler.run(TCPTransport.java:670)
at java.util.concurrent.ThreadPoolExecutor.runWorker(ThreadPoolExecutor.java:1145)
at java.util.concurrent.ThreadPoolExecutor$Worker.run(ThreadPoolExecutor.java:615)
at java.lang.Thread.run(Thread.java:744)
at sun.rmi.transport.StreamRemoteCall.exceptionReceivedFromServer(StreamRemoteCall.java:275)
at sun.rmi.transport.StreamRemoteCall.executeCall(StreamRemoteCall.java:252)
at sun.rmi.server.UnicastRef.invoke(UnicastRef.java:161)
at com.sun.jmx.remote.internal.PRef.invoke(Unknown Source)
at javax.management.remote.rmi.RMIConnectionImpl_Stub.getAttribute(Unknown Source)
at javax.management.remote.rmi.RMIConnector$RemoteMBeanServerConnection.getAttribute(RMIConnector.java:913)
at com.jrockit.mc.rjmx.subscription.internal.AttributeValueToolkit.getAttribute(AttributeValueToolkit.java:51)
at com.jrockit.mc.rjmx.internal.MCMBeanServerConnection.getAttribute(MCMBeanServerConnection.java:153)
at com.jrockit.mc.dtrace.recorder.internal.remote.MBeanToolkit.invokeOperation(MBeanToolkit.java:53)
… 6 more
Could you please help me out
Sattish.
Did you read the provided documentation? 🙂