Developing OpenJDK Mission Control

The last blog (about Fetching and Building OpenJDK Mission Control) earned me questions on how to get the source into Eclipse to start playing around with it. This blog post will assume that you have first successfully completed the steps in the Fetching and Building OpenJDK Mission Control blog post.

Getting Eclipse

First of all you should download the latest version of Eclipse. JMC is an RCP application, and thus, the easiest way to make changes to it, is to use the Eclipse IDE.

There are various Eclipse bundles out there. Get (at least) the Eclipse IDE for Eclipse Committers. It adds some useful things, like PDE (the Plugin Development Environment), Git, the Marketplace client and more. You can also use the Eclipse IDE for Java Enterprise Developers.

You will need an Eclipse 2018-12 or later!

To get to the screen where you can select another packaging than the standard, click on the Download Packages link on the Eclipse download page.


Install it, start it and create a new workspace for your JMC work. Creating a new workspace is as easy as picking a new name when starting up your Eclipse in the dialog asking for a directory for the workspace:
image

Installing JDKs

Since you’ve already built JMC outside of the IDE, you already have a JDK 8. You probably also want to have a JDK 11 set up in your Eclipse.

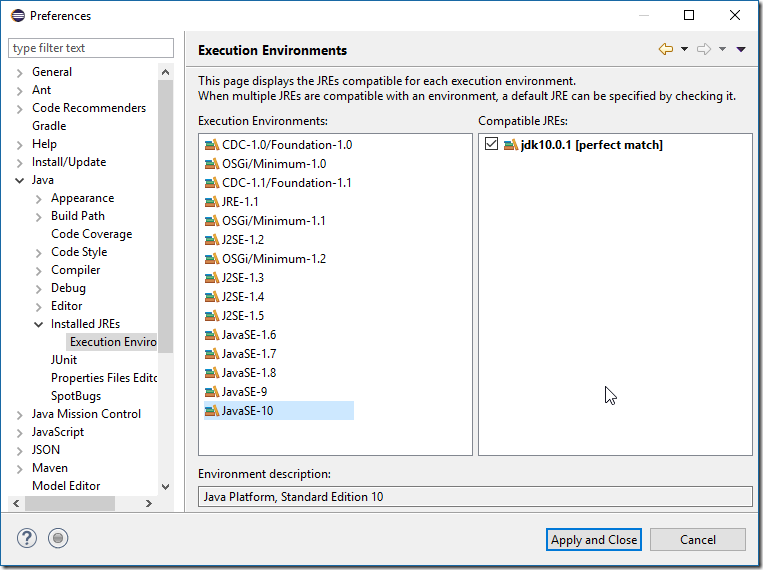
Download and install a JDK11, then open Window | Preferences and then select Java / Installed JREs. Add your favourite JKD 8 and JDK 11 JDKs (Add…) and then use Java / Installed JREs / Execution Environments to set them as defaults for the JDK 8 and JDK 11 execution environments.

Note to JMC lovers:

You may want to ensure that a JDK is used to run your Eclipse, and not a jre. A JDK is needed for JMC to find the tools.jar, where the classes required for JMC to discover locally running JVMs are located. Simply add the –vm flag in your eclipse.ini file, and point it to your JDK:

image


Setting installed JREs:

image

Setting execution environments:

image

Okay, we now have our JDKs set up. Next step is to set up a user library for things that JMC will need from the JDK. This is directly from the JMC readme:

If importing the application projects, make sure you create a user library (Preferences | Java/Build Path/User Libraries) named JMC_JDK, and add (Add External JARs…) the following JARs from a JDK 8 (u40 or above) to the User Library: tools.jar (/lib/tools.jar), jconsole.jar (/lib/jconsole.jar), jfxswt.jar (/jre/lib/jfxswt.jar), and finally the jfxrt.jar (/jre/lib/ext/jfxrt.jar).

Creating the user library:

image

Adding the jars:

image

Now we need to check a few things…

Checkpoint

Is the Jetty server from the previous blog up and running?
image

If yes, go ahead and open up the target file available under releng/platform-definitions/platform-definition-photon (File | Open File). You should see something like this:

image

Click the Set as Active Target Platform link in the upper right corner.

Now there is one final preparation for the import – we need to turn of certain Maven settings. Go to the preferences, and select Maven / Errors/Warnings. Set Plugin execution not covered by lifecycle configuration to Ignore, and also Out-of-date project configuration to Ignore

image

Now the preparations are done, and we can start importing the projects. Woho!

Importing the Projects

First we will have to import the core projects, since they are built separately from the rest. Select File | Import… and select Maven / Existing Maven Project.
image

Click next, and browse into the jmc/core folder. Select all the core projects and import them. (You may want to skip the top level poms.)

Next select File | Import… and select Maven / Existing Maven Project again, but this time from the root:

Again, you may want to skip the top level poms (/pom.xml, application/pom.xml etc), and the uitests (at least until we fix so that the jemmy dependency can be downloaded from Maven Central).
image

Next we will import the project which contains the launchers. Select File | Import… and then select Existing Projects into Workspace. Find the configuration/ide/eclipse folder and click Ok.

image

After importing that project, we can now launch JMC from within Eclipse:

image

Or run it in debug mode:

image

Configuring Development Settings

If you don’t plan on submitting any changes, then this step is optional. The team use shared settings for formatter and macros. Go to the preferences and then to Java / Code Style / Formatter. Then click Import… and select the configuration/ide/eclipse/formatting/formatting.xml. You should now have the Mission Control formatting settings active:

image

Optional:

If you have the spotbugs plug-in installed, you should also import the spotbugs excludes (configuration/spotbugs/spotbugs-exclude.xml). There is also a common dictionary (configuration/ide/eclipse/dictionary/dictionary.txt) and templates (configuration/ide/eclipse/templates/JMC templates.xml) which you may find useful.

Adding (and Launching with) Some Custom Plug-in

The flame graph view may be included in JMC at some point. If so, then there will probably be some other plug-in somewhere that will serve as an example.

First install Git. If you, on the command line, can run git –version, you’re all set.

Next go to your git folder (or wherever you keep your git projects) and clone the jmc-flame-view repo:

git clone https://github.com/thegreystone/jmc-flame-view

Next go to Eclipse and do File | Import…, and select Existing Projects into Workspace. Select your jmc-flame-view folder, and click Finish:

image

Next we need a launcher which includes this new feature. Go to the org.openjdk.jmc.eclipseonfig project and open the launchers folder. Copy and paste the JMC RCP plug-ins.launch file. Name the copy something.

image

Click the run dropdown and select Run Configurations….

image

Select your new launcher, and click the Plug-ins tab. Add the new Flame Graph feature:

image

Click Apply and Run. Mission Control will start, with your new plug-in available. In the started JMC, go to Window | Show View | Other…. Select Mission Control / Flame Graph in the Show View dialog. Open a Flight Recording, and click on something that would yield an aggregated stack trace, such as something in the Method Profiling page, or a class in the Memory page – you should now see a Flame Graph of your selection.

Summary

This blog post explained, in some detail, how to import the OpenJDK Mission Control project into Eclipse, and how to set up the workspace to work on the code. It also explained how to run the code with an additional plug-in from a separate repo.

As always, please let me know if I forgot to mention something (except for the agent, which I will deal with in a separate post)!

Fetching and Building OpenJDK Mission Control

(Please note that an updated version of this article, for JMC 8+, is available here: https://hirt.se/blog/?p=1196.)

Since people keep asking me, I thought I’d put together this quick primer on how to get started with OpenJDK Mission Control. Now, once the early access builds of JMC 7 is out, that will probably be the easiest way to get started for people who don’t want to change stuff. This blog, however, will be for the ones of you who would like to build JMC from source.

Getting Mercurial

First step is to get Mercurial, the SCM used for OpenJDK. JMC (being an OpenJDK project) is available through a Mercurial repository. Installing Mercurial is different for different platforms:

Mac OS X

Easiest is to install through Homebrew:

brew install mercurial

That said, dmg packages can also be downloaded from here: https://www.mercurial-scm.org/wiki/Download.

Windows

Go to https://www.mercurial-scm.org/wiki/Download. Download the InnoSetup based installer and run it. Ensure that the “add to path” checkbox is checked. Verify that the install went fine by opening a command prompt and typing hg and enter. A list of the available commands should be printed.

Linux

For Debian based distributions, you can install using the package manager:

sudo apt-get install mercurial

That said, you can also get rpms and other installation packages from here: https://www.mercurial-scm.org/wiki/Download.

Cloning the Source

Once Mercurial is installed properly, getting the source is as easy as cloning the jmc repo. First change into the directory where you want to check out jmc. Then run:

hg clone http://hg.openjdk.java.net/jmc/jmc/

Getting Maven

Since you probably have some Java experience, you probably already have Maven installed on your system. If you do not, you now need to install it. Simply follow the instructions here:

https://maven.apache.org/install.html

Building Mission Control

First we need to ensure that Java 8 is on our path. Some of the build components still use JDK 8, so this is important.

java –version

This will show the Java version in use. If this is not a Java 8 JDK, change your path. Once done, we are now ready to build Mission Control. Open up two terminals. Yep, two!

In the first one, go to where your cloned JMC resides and type in and execute the following commands (for Windows, replace the dash (/) with a backslash (\)):

cd releng/third-party
mvn p2:site
mvn jetty:run

Now, leave that terminal open with the jetty running. Do not touch.

In the second terminal, go to your cloned jmc directory. First we will need to build and install the core libraries:

cd core
mvn install

Next run maven in the jmc root:

mvn clean package

JMC should now be building. The first time you build Maven will download all of the third party dependencies. This will take some time. Subsequent builds will be less painful. On my system, the first build took 6:01 min. The subsequent clean package build took 2:38.

Running Mission Control

To start your recently built Mission Control, run:

Windows

target\products\org.openjdk.jmc\win32\win32\x86_64\jmc.exe -vm %JAVA_HOME%\bin

Mac OS X

target/products/org.openjdk.jmc/macosx/cocoa/x86_64/JDK\ Mission\ Control.app/Contents/MacOS/jmc -vm $JAVA_HOME/bin

Contributing to JDK Mission Control

To contribute to JDK Mission Control, you need to have signed an Oracle Contributor Agreement. More information can be found here:

http://openjdk.java.net/contribute/

Don’t forget to join the dev list:

http://mail.openjdk.java.net/mailman/listinfo/jmc-dev

If there is interest, I will add a more detailed blog post on this later.

More Info

For more information on how to run tests, use APIs etc, there is a README.md file in the root of the mercurial repo. Let me know in the comments section if there is something you think I should add to this blog post and/or the README!

JMC Open Sourced!

This is going to be a short blog post, because it is past bedtime and I’m frankly pretty beat. Just wanted to say thank you to everyone who helped open source Java Mission Control in the relatively short period of time it was done in.

So a huge thank you to everyone on the Stockholm JMC team: Klara Ward, Ola Westin, Henrik Dafgård, Erik Greijus and Per Kroon. And to Dalibor Topic, who had the thankless job to go through all the source and built artifacts checking on, among other things, licenses and copyrights. Also thank you to Donald Smith for handling the internal license approval process, and Mark Reinhold for advice. Also, a big thank you to Guru, who is prepping to start building Oracle binary builds of the OpenJDK project. And to Iris who published the repos and set up the project on OpenJDK. And to everyone who I’ve forgotten to mention, since my brain is no longer really functioning at 2 a.m. You guys rock!

The repositories are available here:

      http://hg.openjdk.java.net/jmc

  • The jmc repo contains the source, which is buildable using Maven.
    Everything you need to know about building JMC is in the README.txt
    Please read it first, thoroughly, before asking questions.
  • The jmc-graphics repo contains artwork and graphic files, like splash screens and icons.

We also have a slack at https://jdkmissioncontrol.slack.com/.

If you have any questions, don’t hesitate to ask!

Kind regards,
Marcus

JMC & JFR in JDK 9 Labs

So JavaOne 2017 has now come and gone. This year it was a pretty great one! The Java keynote was IMHO the best one in years, with plenty of great announcements and interesting content. The sessions I managed to attend were also very high quality. Not to mention the dinners and the parties. Winking smile

One of the sessions I did this year was a hands-on-lab on Java Mission Control 6 and Java Flight Recorder in JDK 9.

IMG_6670

Since it was full, and since people who could not attend have asked for it, I promised to put the HoL on my blog. Well, here it is!

There are three files:

  1. The lab instructions.
  2. The full lab content for Windows x64 (easiest, but largest download, 856MiB).
  3. The project files only (all other platforms, 39MiB).

Hope this helps!

Please let me know if you find any errors in the labs, or if you get stuck!

/M

JMC 6 Automated Analysis Headless

This post will be a little bit wider than the title implies; it will be about using the JMC core JFR APIs in general. That said, one of the things we will be using it for, towards the end, will be to run the JMC 6 automated analysis headless.

This article will also cheat by talking about JMC 6.1, so that anyone reading this article will have relevant information for JMC 6.1 as well. Winking smile 

The JAR-files Needed

To run these examples you will need to have the following Jar-files from the JDK_HOME/lib/missioncontrol/plugins folder on your classpath:

Prefix

Version needed

Comment

com.oracle.jmc.common

>= 6.0.0

Classes common to JMC, such as stacktrace definitions, the content type system (quantities/ units of measurement) etc.
com.oracle.jmc.flightrecorder

>= 6.0.0

The Java Flight Recorder parser, classes for extracting information from a recording.
com.oracle.jmc.flightrecorder.rules

>= 6.0.0

The core definitions and classes for automated analysis of recordings.
com.oracle.jmc.flightrecorder.rules.jdk

>= 6.0.0

Contains the rules for the JDK (such as rules for synchronization trouble, long lasting VM operations and much more).
com.oracle.jmc.flightrecorder.ext.wls.parser

>= 6.0.0

(Optional, only relevant for users wanting WebLogic Server extensions)
com.oracle.jmc.flightrecorder.ext.wls.rules

>= 6.0.0

(Optional, only relevant for users wanting WebLogic Server extensions)

Loading a Recording

Loading a recording is done through a call to the JfrLoaderToolkit#loadEvents(). It takes a file argument, and returns an IItemCollection. The IItemCollection can be thought of as a collection of events.

The IItemCollection supports operations like filter(), and getAggregate(). Used correctly, you should rarely need to rely on external iteration.

Here is an example which loads a recording, and calculates the standard deviation for the java monitor enter events in a recording:

import java.io.File;

import com.oracle.jmc.common.IDisplayable;
import com.oracle.jmc.common.item.Aggregators;
import com.oracle.jmc.common.item.IItemCollection;
import com.oracle.jmc.common.item.ItemFilters;
import com.oracle.jmc.common.unit.IQuantity;
import com.oracle.jmc.flightrecorder.JfrAttributes;
import com.oracle.jmc.flightrecorder.JfrLoaderToolkit;
import com.oracle.jmc.flightrecorder.jdk.JdkTypeIDs;

/**
 * Finds out the standard deviation for the java monitor enter events.
 */
public class LoadRecording {
	public static void main(String[] args) throws Exception {
		DemoToolkit.verifyFirstFileArgument(RunRulesOnFile.class, args);
		
		IItemCollection events = JfrLoaderToolkit.loadEvents(new File(args[0]));
		IQuantity aggregate = events.apply(ItemFilters.type(JdkTypeIDs.MONITOR_ENTER))
				.getAggregate(Aggregators.stddev(JfrAttributes.DURATION));
		
		System.out.println("The standard deviation for the Java monitor enter events was "
				+ aggregate.displayUsing(IDisplayable.AUTO));
	}
}

Note the stream-like syntax. The JMC libraries work well together with streams, but are compiled on JDK 7, and can run on a JDK 7 compliant runtime. Also note that some class names start with Jfr whilst others class names start with Jdk. The difference being that some concepts, like DURATION, are intrinsic to JFR, whilst other are defined in terms of the Java JDK classes or runtime, like MONITOR_ENTER.

The JMC core libraries provide common statistical aggregators, and accessors for common attributes. Should you feel something is missing, it is easy to add to the built-in operations.

Also note the IQuantity returned by the aggregator. The built-in system for handling quantities and units of measurement makes it easy to calculate with, and display, quantities in different units of measurement.

Performing an Automated Analysis Headless

It is also easy to run the JMC rules headless using these core libraries. Simply evaluate the rules against the IItemCollection. Here is a simple example iterating through the rules and evaluating them one by one:

import java.io.File;
import java.util.concurrent.RunnableFuture;

import com.oracle.example.jmc6jfr.rules.util.DemoToolkit;
import com.oracle.jmc.common.item.IItemCollection;
import com.oracle.jmc.common.util.IPreferenceValueProvider;
import com.oracle.jmc.flightrecorder.JfrLoaderToolkit;
import com.oracle.jmc.flightrecorder.rules.IRule;
import com.oracle.jmc.flightrecorder.rules.Result;
import com.oracle.jmc.flightrecorder.rules.RuleRegistry;

public class RunRulesOnFileSimple {
	public static void main(String[] args) throws Exception {
		File recording = DemoToolkit.verifyRecordingArgument(RunRulesOnFileSimple.class, args);
		IItemCollection events = JfrLoaderToolkit.loadEvents(recording);
		
		for (IRule rule : RuleRegistry.getRules()) {
			RunnableFuture<Result> future = rule.evaluate(events, IPreferenceValueProvider.DEFAULT_VALUES);
			future.run();
			Result result = future.get();
			if (result.getScore() > 50) {
				System.out.println(String.format("[Score: %3.0f] Rule ID: %s, Rule name: %s, Short description: %s",
						result.getScore(), result.getRule().getId(), result.getRule().getName(),
						result.getShortDescription()));
			}
		}
	}
}

That said, if you are not constrained to have to run on JDK 7, you can always run the rules in parallel, for example by employing parallel streams:

import java.io.File;
import java.util.List;
import java.util.concurrent.ExecutionException;
import java.util.concurrent.Executor;
import java.util.concurrent.Executors;
import java.util.concurrent.RunnableFuture;
import java.util.stream.Collectors;
import java.util.stream.Stream;

import com.oracle.jmc.common.item.IItemCollection;
import com.oracle.jmc.common.util.IPreferenceValueProvider;
import com.oracle.jmc.flightrecorder.JfrLoaderToolkit;
import com.oracle.jmc.flightrecorder.rules.IRule;
import com.oracle.jmc.flightrecorder.rules.Result;
import com.oracle.jmc.flightrecorder.rules.RuleRegistry;

/**
 * Runs the rules on the events in the specified file in parallel, then prints
 * them in order of descending score.
 */
public class RunRulesOnFile {
	private final static Executor EXECUTOR = Executors
			.newFixedThreadPool(Runtime.getRuntime().availableProcessors() - 1);
	private static int limit;

	public static void main(String[] args) throws Exception {
		if (args.length == 0) {
			System.out.println(
					"Usage: RunRulesOnFile <recording file> [<limit>]\n\tThe recording file must be a flight recording from JDK 7 or above. The limit, if set, will only report rules triggered with a score higher or equal than the limit.");
			System.exit(2);
		}
		IItemCollection events = JfrLoaderToolkit.loadEvents(new File(args[0]));
		if (args.length > 1) {
			limit = Integer.parseInt(args[1]);
		}
		Stream<RunnableFuture<Result>> resultFutures = RuleRegistry.getRules().stream()
				.map((IRule r) -> evaluate(r, events));
		List<Result> results = resultFutures.parallel().map((RunnableFuture<Result> runnable) -> get(runnable))
				.collect(Collectors.toList());
		results.sort((Result r1, Result r2) -> Double.compare(r2.getScore(), r1.getScore()));
		results.stream().forEach(RunRulesOnFile::printResult);
	}

	public static RunnableFuture<Result> evaluate(IRule rule, IItemCollection events) {
		RunnableFuture<Result> evaluation = rule.evaluate(events, IPreferenceValueProvider.DEFAULT_VALUES);
		EXECUTOR.execute(evaluation);
		return evaluation;
	}

	public static Result get(RunnableFuture<Result> resultFuture) {
		try {
			return resultFuture.get();
		} catch (InterruptedException | ExecutionException e) {
			e.printStackTrace();
		}
		return null;
	}

	private static void printResult(Result result) {
		if (result.getScore() >= limit) {
			System.out.printf("(%.0f) [%s]: %s\nDetails:\n%s\n============<End of Result>============\n",
					result.getScore(), result.getRule().getId(), result.getShortDescription(),
					result.getLongDescription() == null ? "<no description>" : result.getLongDescription());
		}
	}
}

If you do not need that kind of control, there is a class available for performing automated analysis included with the JMC core library. To run an automatic analysis, simply run the class:

com.oracle.jmc.flightrecorder.rules.report.JfrRulesReport <files> –format <format> –min <severity>

…where files is one or more recordings, and <format> is and <min> is minimum severity to report [ok | info | warning]. In JMC 6.1.0 there is one additional class for generating the file, which produces an HTML in a format and style very similar to the looks of the JMC 6.0.0 Automated Analysis page:

com.oracle.jmc.flightrecorder.rules.report.html.JfrHtmlRulesReport <file> [<outputfile>]

…where <file> is the (single) recording to analyze, and where the optional <outputfile> is where the resulting HTML should be written. If no outputfile is specified, the result of the analysis will be written on stdout.

Adding Custom Rules

It’s easy to add you own heuristics. Do you find yourself with thousands of recordings, and would like to add a Bayesiean network to do some machine learning? The rules are all pure Java, so you can pretty much do whatever you want in a rule.

The easiest way to get started writing your own custom rules is to get yourself an Eclipse Oxygen or later, and install JMC and the experimental PDE plug-in into your Eclipse.

  1. Install Eclipse Oxygen or later.
  2. Got to the Mission Control homepage, and find the Eclipse Update site.
  3. Follow the instructions to install the Mission Control plug-ins.
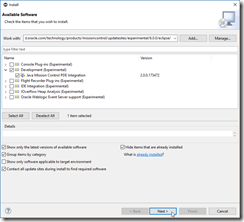
    image
  4. Got to the Mission Control homepage, and find the Experimental Update site.
  5. Install the PDE plug-in.
    image

Here is a cheat sheet for the eclipse update sites for the JMC 6.0.0 release:

http://download.oracle.com/technology/products/missioncontrol/updatesites/base/6.0.0/eclipse/

http://download.oracle.com/technology/products/missioncontrol/updatesites/supported/6.0.0/eclipse/

http://download.oracle.com/technology/products/missioncontrol/updatesites/experimental/6.0.0/eclipse/

(JMC 6.1.0 will be released according to the same URL pattern.)

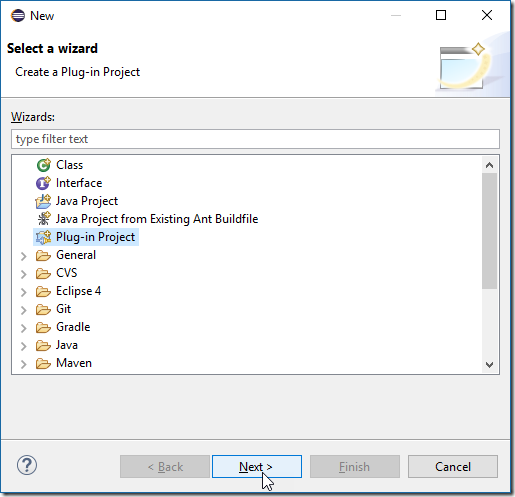
To start building your rule, press ctrl-n (or click the File | New | Other… menu) to bring up the New wizard.
image

Select Plug-in Project and hit Next. Name your rule project something exciting.
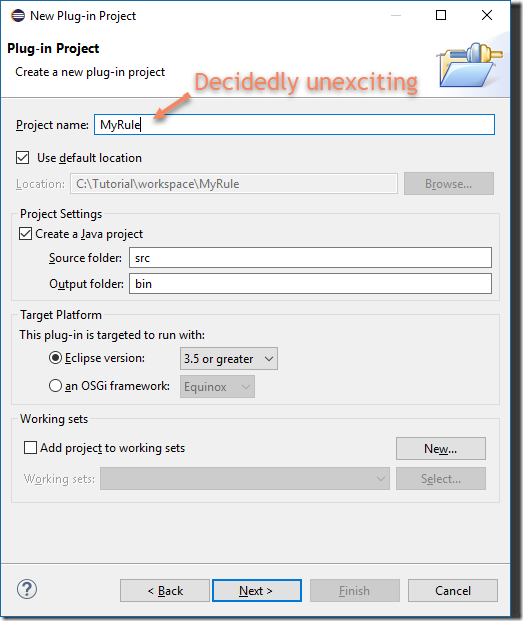
pic

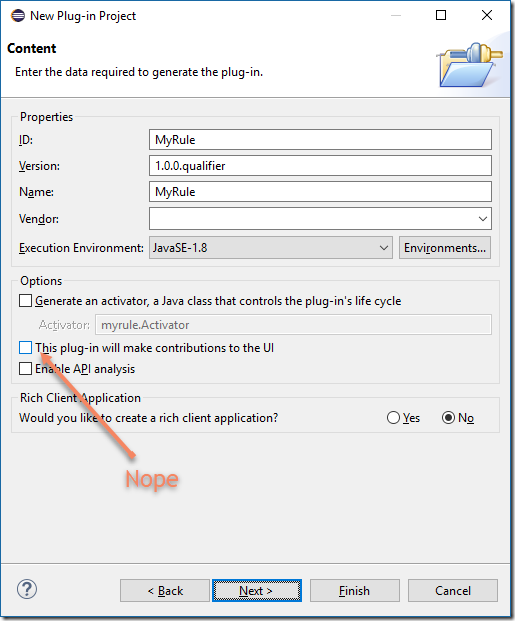
Unclick that this plug-in will make contributions to the UI and hit Next.
pic2

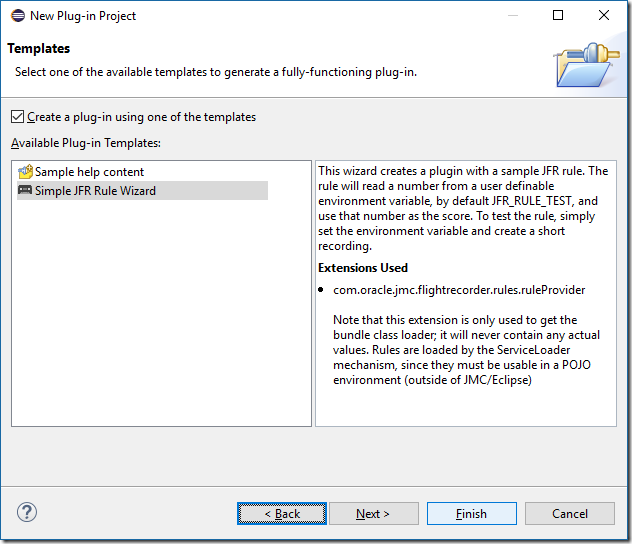
Next select the Simple JFR Rule Wizard and click Finish (or Next, if you really wish to do some further customizations).
pic3

You will now have a new project in your workspace, containing an example rule. If you have compilation errors, you need to set JMC to be your target platform (see the next section). You can either just export your rule, put it on the class path with the other core libraries, or you can try out your rule by running JMC from within Eclipse with your new rule.

Starting JMC from within Eclipse with Workspace Plug-ins

Running JMC from within Eclipse with any plug-ins you are currently developing is a simple matter of setting the plug-in development target platform to your JMC installation, and launching that platform with your workspace plug-ins.

First set JMC to be your target platform.

  1. Go to Preferences in the main menu (Window | Preferences on Windows).
  2. Find Target Platform by typing Tar in the filter box:
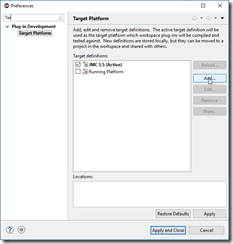
    image
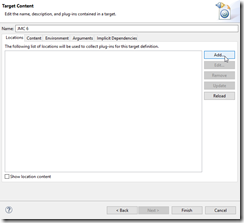
  3. Click Add… and type JMC 6 as name.
    image
  4. Press Add… and select Installation. Hit Next.
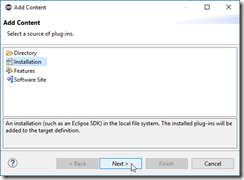
    image
  5. Browse to the JMC 6 installation directory (JDK_9_HOME/lib/missioncontrol), and hit Ok.
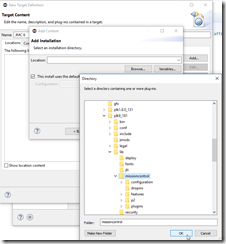
    SNAGHTML1538a63d
  6. Hit Finish, and Finish. You should now see your new platform.
    image
  7. Select the new JMC 6 platform, and hit Apply and Close to activate it.
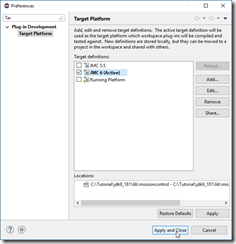
    image

Everything should now compile cleanly. Next step is to run JMC with your new rule.

  1. Context click on your project and select Run as Eclipse Application
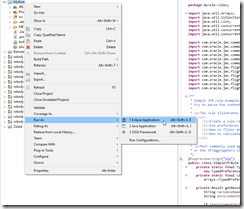
    SNAGHTML153e5cb4
  2. This should normally be it. If you for some reason run into trouble, go to Run Configurations, and make sure that your launcher is using the com.oracle.jmc.rcp.application.product.
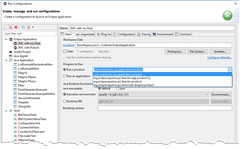
    SNAGHTML1540e14b

You should now be able to see your rule in action. If you have not changed the rule code, try setting the environment variable in the launcher to various values between 0 and 100 and see what happens when you run the rule in JMC:
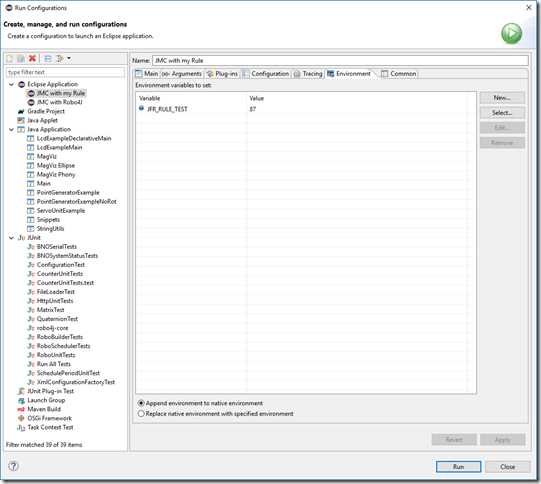
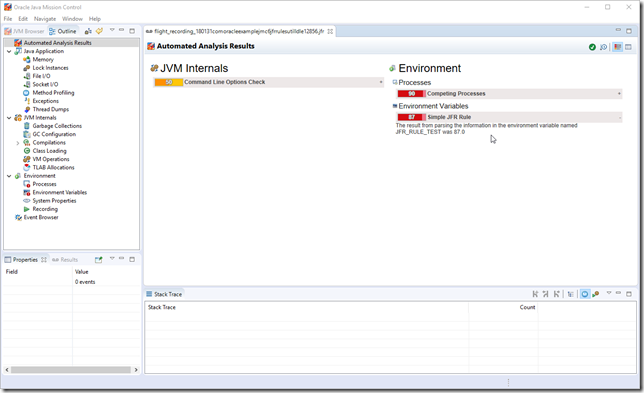
image

image

Exporting a Plug-in

You can export your rule by context-clicking on the project and selecting Export. In the Export wizard, select Deployable plug-ins and Fragments.

image 

Click Next, select a folder to export the plug-in to and Finish. The resulting jar can either be put on the class path to be included in the headless analysis, or put in the dropins folder of any Java Mission Control installation where you would want the rule to be available.

Summary

This blog described how to:

  • Get started using the JMC core libraries to read Java Flight Recordings (JDK 7, 8 and 9)
  • Get started doing headless analysis of Java Flight Recordings (JDK 7, 8 and 9)
  • Get started creating custom rules for analyzing Java Flight Recordings

Hope it helps someone!
Java Flight Recorder in JDK 9

As you probably already know, JFR is on the road to be open sourced. The plans are being drawn, and if everything goes well, this could happen as early as in JDK 10 (JDK 18.3). No promises, and please do not give anyone a hard time if this doesn’t work out. Know that we tried. Anyways, what we did recently do was to release JDK 9, and there are a LOT of exciting stuff happening for JFR already in JDK 9. Smile

Let’s dive into it…

Supported APIs

Yep. The JFR APIs in the JDK are supported. This means that unlike all my other posts on JFR related APIs, this post does not contain any disclaimer for using these APIs. They are supported! By Oracle! Woho!

On the sad side, this also means that the APIs have changed package, and signatures. On the plus side, they have been immensely enhanced for readability, performance and ease of use.

I will group the API as follows:

  • API for Custom Events
  • API for Controlling the Flight Recorder
  • API for Consuming Recordings

Now, there is an advanced API for consuming recordings included with JMC. That API sports internal iteration, aggregation in various forms, JDK 7, 8 and 9 JFR file compatibility, JDK 7 and later execution compatibility, POJO (no weird dependencies), rules evaluation, and more. This API will also be open sourced, and I will discuss it in a later post.

Creating Custom Events

The API for creating and recording your own events is very simple. All you need to do is to subclass jdk.jfr.Event.and annotate the fields you wish to record with jdk.jfr.Label.

import jdk.jfr.Event;
import jdk.jfr.Label;

public class Hello {
	@Label("Hello World")
	static class HelloWorldEvent extends Event {
		@Label("Message")
		String message;
	}
	public static void main(String... args) {
		HelloWorldEvent event = new HelloWorldEvent();
		event.message = "Hello World event message!";
		event.commit();
	}
}

It is good form to provide a description for your event class and for non-trivial attributes. Here is an example of an event from a JUnit plug-in for JUnit 5 (that I have not released for JDK 9 yet):

/**
 * Event for a test run and completed normally (without exception).
 * 
 * @author Marcus Hirt
 */
@Label("Test Run")
@Description("JUnit test executed and completed normally without exception")
@Category("JUnit")
public class TestEvent extends Event {
    @Label("Display Name")
    @Description("The JUnit display name for the test")
    private String displayName;

    public void setDisplayName(String displayName) {
        this.displayName = displayName;
    }

    public String getDisplayName() {
        return displayName;
    }
}

Other important annotations are, for example, the annotation for providing information about the content. These annotations are put on fields to explain to tools how to interpret the data. For example, Java Mission Control would be able to properly render timestamps and durations properly, if the appropriate @Timestamp and @Timespan annotations were used. I have provided a quick overview of some of the most commonly used ones below:

Annotation Comment
@Address The value is a memory address
@BooleanFlag The value is a boolean flag. Strictly speaking perhaps not the most useful one.
@Frequency The value is a frequency, in Hz
@MemoryAddress The value is a memory address.
@MemoryAmount The value is an amount of memory, in bytes.
@NetworkAddress The value is a network address. Value is a long below 2^32 or an unsigned integer and clients will likely display it in the usual octet format (e.g. 127.0.0.1).
@Percentage The event is a fraction, typically between 0 and 1, and is best represented as a percentage
@Timespan The event is a duration. Defaults to nanoseconds, but can be changed by setting value to one of the static fields defined in Timespan: MICROSECONDS, MILLISECONDS, NANOSECONDS, SECONDS, TICKS. It is always nice to explicitly set value (even for NANOSECONDS), so that it can be readily seen what was intended.
@Timestamp The event is a timestamp. Defaults to MILLISECONDS_TO_EPOCH, but can be changed by setting value to one of the static fields defined in Timestamp: MILLISECONDS_SINCE_EPOCH, TICKS. It is always nice to explicitly set value (even for MILLISECONDS_SINCE_EPOCH), so that it can be readily seen what was intended.

There are other annotations worth knowing about such as these:

Annotation Comment
@Enabled Determines if the event should be enabled by default. Remember the bad old days when you added an event, and then did not see it recorded, since the template did not include it? No more. Also, events are enabled by default, so be careful to explicitly set this to false if the event is expensive. Enable is true by default.
@Experimental The element is experimental, and may change in future versions without prior notice.
@Label The human readable label for the element. Use headline-style capitalization, capitalize first and last words, and all nouns, pronouns, verbs and adverbs. Do not include punctuation.
@Period The default period for a periodic event.
@Registered Events are automatically registered by default when they are first used. This annotation can override this behaviour. If you want to make sure that an event which is not likely to be encountered is registered, perhaps to make the metadata available to tools, you can use FlightRecorder.register(class) to register the event programatically.
@Threshold Defines the default threshold for the event. When an even have a duration lower than the threshold, it will not be recorded. The user can override this threshold in the template settings.
@Unsigned The field value should be treated as an unsigned value.


This is by no means an exhaustive list of all the annotations, and as soon as I find out where the javadocs will end up, I will add a link to them.

Note that the programming model is simpler, compared to previous releases. There is no Producer with which you need to register the events. The life cycle of an event simply follows the life cycle of the event class. Also, new event types are enabled by default. As a matter of fact, all the defaults for an event type can be configured using annotations. Also, compared to previous releases, you do not need to explicitly reuse event objects and keep event tokens around; care has been taken to ensure that events on the hot path should be easy to scalarize.

API for Controlling the FlightRecorder

In JDK 9 there are actually two, related, APIs for controlling the FlightRecorder. Just like before, there will be a JMX API. This API provides similar capabilities as the JDK 8 JMX API, but the API has been cleaned up and moved from the com.oracle.jrockit domain to the jdk.management.flightrecorder domain.

image

I will not spend much time on the JMX API. A good example on how to use the different versions of it will be provided in the JMC source, once it is open sourced.

Another addition is an easy to use local API for controlling the Flight Recorder. Here is an example which starts a recording, records the calculation of the first 50 Fibonacci numbers and writes the recording to disk:

import java.io.IOException;
import java.nio.file.Path;
import java.nio.file.Paths;

import com.oracle.example.jdk9jfr.fib.Fibonacci;
import com.oracle.example.jdk9jfr.fib.FibonacciEvent;

import jdk.jfr.Recording;

/**
 * Example program both controlling the recorder and parsing the resulting data.
 * 
 * The program will calculate the 50 first Fibonacci numbers, then print them
 * out.
 */
public class RecordOnly {
	public static void main(String[] args) throws IOException {
		if (args.length == 0) {
			System.out.println("Need to specify a location for the recording!");
			System.exit(2);
		}
		
		Path path = Paths.get(args[0]);

		try (Recording recording = new Recording()) {
			recording.setName("Fibonacci Recording");
			recording.start();
			recording.enable(FibonacciEvent.class);
			for (int n = 0; n &lt; 50; n++) {
				System.out.println("Calculating fib " + n);
				FibonacciEvent event = new FibonacciEvent();
				event.number = n;
				event.begin();
				event.value = Fibonacci.fibonacciIterative(n);
				event.commit();
			}
			recording.stop();
			recording.dump(path);
		}
	}
}

Consuming Recordings

There is a very easy to use API for consuming the recordings included in the JDK as well. It is only supported to use it to read recordings produced from the same JDK as the API reading it, and it is only supported to run the parser in the same JDK with which it is provided. So, in short, JFR recordings produced by JDK 9, and the parser running on JDK 9.

As I mentioned in the beginning, there is another parser included in JMC, with supported reading JDK 7, 8 and 9 recordings, and which supports internal iteration, aggregation in various forms, JDK 7 and later execution compatibility, and rules evaluation. It is still POJO, so it can be included into anything. Which parser to use depends on what you are trying to accomplish.

Here is an addition to the previous example which also reads the produced recording using the Parser built into the JDK, and which then writes out information from the captured events on stdout:

import java.io.IOException;
import java.nio.file.Path;
import java.nio.file.Paths;

import com.oracle.example.jdk9jfr.fib.Fibonacci;
import com.oracle.example.jdk9jfr.fib.FibonacciEvent;

import jdk.jfr.Recording;
import jdk.jfr.consumer.RecordedEvent;
import jdk.jfr.consumer.RecordingFile;

/**
 * Example program both controlling the recorder and parsing the resulting data.
 * 
 * The program will calculate the 50 first Fibonacci numbers, then print them
 * out.
 */
public class RecordAndConsume {
	public static void main(String[] args) throws IOException {
		if (args.length == 0) {
			System.out.println("Need to specify a location for the recording!");
			System.exit(2);
		}
		
		Path path = Paths.get(args[0]);

		try (Recording recording = new Recording()) {
			recording.setName("Fibonacci Recording");
			recording.start();
			recording.enable(FibonacciEvent.class);
			for (int n = 0; n &lt; 50; n++) {
				System.out.println("Calculating fib " + n);
				FibonacciEvent event = new FibonacciEvent();
				event.number = n;
				event.begin();
				event.value = Fibonacci.fibonacciIterative(n);
				event.commit();
			}
			recording.stop();
			recording.dump(path);
			for (RecordedEvent event : RecordingFile.readAllEvents(path)) {
				int number = event.getValue("number");
				long value = event.getValue("value");
				System.out.printf("fibonacci(%d) = %d (time: %dns)\n", number, value, event.getDuration().getNano());
			}
		}
	}
}

Other Improvements to JFR in JDK 9

Here is a list of some other improvements to JFR in JDK9:

  • Modularized APIs (if you do not need the JMX API, don’t include it).
  • Extensible APIs (can provide custom settings for event types, can provide custom metadata using annotations)
  • Performance improvements (more on this later)
  • Can emit data even in bad situations (Out of Memory for example)
  • New events
    • More detailed safe point information
    • More detailed code cache information
    • New PLAB (promotion) events
    • New compiler events for detailed inlining information
    • New H1 specific information for better visualization of region states
    • Module events (loaded modules, full transitive closure)
    • NativeLibrary (load, a periodic event, by default emitted each chunk)
    • …and more. Just make a test recording and include them all. Winking smile

Performance Enhancements

Here is a graphic (provided by my excellent friend Erik Gahlin at the Oracle JPG Serviceability Team), which shows some of the areas where JFR has improved in JDK 9:

image

Let’s take them in order:

  1. The time spent in safepoints due to chunk rotation to disk has been reduced from a bit over 7ms to almost nothing.
  2. If you have code with a disabled Java event, the overhead of having the event related code in your method will be zero (if that code is on the hot path). After optimization, any trace of the event related code will be optimized away.
  3. The overhead of writing an event (without capturing stack traces), has gone from 8ns to 6ns.
  4. The file size (and buffer memory usage) has roughly been cut by half, due to the introduction of compressed integers.
  5. The time required to capture a stack trace has been almost cut in half.
  6. Even the startup has been slightly improved.

So, not only have the APIs become easier to use, and more comprehensive. JFR has also become significantly faster. That is a bit of a feat, considering that it wasn’t very slow to begin with.

Summary

The new Java release, JDK 9, provides plenty of improvements to JFR:

  1. Supported API
  2. Simplified programming model
  3. Higher performance

This blog provided a quick introduction to JFR in JDK 9, with some simple examples.

Here is a link to the full source for the examples: source_jdk9_jfr_examples.zip

Stop Wasting Your Heap

The Java Virtual Machine is a wonderful little piece of software. It provides the illusion of an infinite heap – as long as you stop referring to instances you no longer need, you can keep going forever. Allocate as many little temporary object as you like; you do not have to worry about running out of memory. The JVM will automatically reclaim the memory when needed.

That said, the amount of memory that you reference at any given time, sometimes referred to as the live set, is limited by whatever memory is available to the Java heap. If you get an OutOfMemoryError, you either have a memory leak, or your application is trying to keep more memory live than can fit on the heap.

For solving the memory leak case, I will soon be demoing something pretty exciting at JavaOne 2017 that we’ve been working on (stay tuned). But what if the application is simply keeping alive too much memory? How do you go about reducing the amount of live memory required to run your application?

One way is to limit your application in various ways. Only allow N number of simultaneous users, crank down various caches you may have used in your application to speed up certain operations etc. Another is to try to look at various heap usage patterns that are known to waste heap memory. You usually end up doing a little bit of everything.

There is a little known experimental plug-in for Java Mission Control called JOverflow which can be helpful for estimating how much memory is wasted due to common heap usage anti-patterns.

Installing JOverflow

JOverflow can easily be installed from within JMC like this:

  1. Start JMC
  2. Go to Help | Install New Software
    SNAGHTML13a75ed2
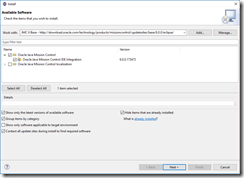
  3. Check Heap Analysis/JOverflow
    image
  4. Click Next, Next, and finally accept the license and Finish

If you are installing into Eclipse, simply use the Experimental update site (can be found from the homepage, http://oracle.com/missioncontrol)

The Example

The example I will be using is a heap dump from an earlier version of Java Mission Control, JMC 4.1.0. In that version we sacrificed quite a lot of heap memory, for a dubious performance optimization.

The heap dump can be downloaded from here: jmc41dump.hprof

Having the example open in JOverflow will allow you to experiment with the UI, and will likely help facilitate the understanding of the rest of this blog post.

Understanding the JOverflow User Inteface

Start by opening a heap dump. If JOverflow is properly installed in JMC (or Eclipse, if running JMC in Eclipse), you should now be presented with the JOverflow user interface.

This is what it looks like on my computer, with the example heap dump (click pictures for full size):

image

There are four quadrants in the JOverflow user interface. Also notice the little reset button in the upper right corner (clip_image002). It will reset all the selections in the user interface.
 

Object Selection

The top left quadrant, Object Selection, will show you what heap usage anti-patterns the analysis has found. The first column in the Object Selection table show the kind of objects found, implicitly telling you what was analyzed for. The second how much memory they use in total. The third column, Overhead, shows how much of the memory was wasted, in percent of the total heap used.

SNAGHTML13c3d562

Referrer Tree-table

The top right quadrant contains the Referrer tree-table. This tree-table will show the aggregated reference chains for whatever is selected. Note that the way to reset the selections in the Referrer tree-table is to right click in the table. This is since you can make multiple consecutive selections to arrive at the reference chain you are interested in.

SNAGHTML13c68918

Note that the calculated overhead is all zero. This is since we have not selected the result of any analysis in the Object Selection table yet.

Class Histogram

The lower left shows a class histogram for whatever is selected, allowing you to filter on class.

SNAGHTML13cb55ea

Note that selections can be done directly in the pie chart. If you want to reset your selection, click the button representing the selection you have made.

SNAGHTML13cd5757

Again, note that the Overhead column is still zero. This is since we have not selected the result of any analysis in the Object Selection table. That said, by selecting something directly in the class histogram, without having something selected in the Object Selection table, we can see what analysis is relevant for the selected class.

Ancestor referrer

The final table, in the lower right, will show the objects grouped by the closest ancestor referrer.

SNAGHTML13d3cf97

It provides a pie chart to show the memory distribution, and filter box, making it easy to home in on instances of classes belonging to specific packages. Now let’s take a look at the actual example.

Reducing Memory Usage – Example

From the Object Selection table, it seems we are wasting 17% of our used heap with 710 sparse arrays. Selecting Sparse Arrays in the Object Selection table shows us a lot immediately:

image

Almost all of the sparse arrays are Object arrays (see class histogram) accounting for 16% of the heap. The Referrer table-tree and the Ancestor referrer table both show that the field CircularArray.m_array keep holding on 8 of these, and that these 8 instances are responsible for almost all of overhead. So, whilst there are indeed 710 sparse arrays in our system, just 8 are responsible for almost all the heap waste.

We want to know where these circular arrays are being used, so we click the top entry in the Referrer tree-table (remember to use right-click if you want to reset the selections you make here).

SNAGHTML13e08c36

So, it would seem that it is our JMX console attribute subscription storage that is wasting all that memory. This was implemented differently in a later release…

Let’s look at the second offender, the Duplicate Strings. First we reset the user interface (clip_image002). Then select Duplicate Strings in the Object Selection table. We immediately recognize that this will be a tougher job, and the law of diminishing returns probably would perhaps make us stop here. That said, it would seem like Eclipse interning some preference related keys, and JMC interning some JMC related Strings would help.

For a more fun example with duplicate strings see the following file: eclipse.hprof, where various duplicate path segment strings account for a lot of the memory waste:

image

Note: IIRC I tried this on a more recent version of Eclipse, and it was no longer an issue.

Summary

  • JOverflow is a plug-in for Java Mission Control
  • It can be used to identify potentially bad heap usage patterns
  • Used correctly it can reduce the amount of live memory required to run your application

Flight Recorder and Mission Control Sessions at JavaOne 2017

So, I did a quick search for Java Mission Control and Java Flight Recorder related sessions, and these are the ones I found:

Session Title

Session ID

Date

Start Time

End Time

Room

Distributed JVM Monitoring and Profiling Made Simple CON6836 2017-10-03
(Tuesday)
8:30 9:15 Moscone West – Room 2022
The Art of Performance Tuning CON4027 2017-10-03
(Tuesday)
9:30 10:15 Moscone West – Room 2022
Distributed Application Diagnostics Made Simple in Next-Gen Oracle Cloud CON6529
(OOW)
2017-10-03
(Tuesday)
12:45 13:30 Moscone West – Room 3924
From Concept to Robotic Overlord with Robo4J CON3021 2017-10-03
(Tuesday)
15:00 15:45 Moscone West – Room 2009
G1GC Concepts and Performance Tuning CON4577 2017-10-04
(Wednesday)
12:45 13:30 Moscone West – Room 2016
Java Flight Recorder in JDK 9/Java Mission Control 6 HOL3018 2017-10-04
(Wednesday)
13:30 15:30 Hilton San Francisco Union Square (Lobby Level) – Golden Gate 4/5
Deep Diagnostics: APM and Oracle Java Flight Recorder in Oracle Cloud CON6916 2017-10-04
(Wednesday)
14:45 15:30 Moscone West – Room 2005

Let me know if I missed any session!

My JavaOne Sessions 2017

Though I feel truly honored to be one of the Featured Speakers at the JavaOne 2017 home page, I wish someone could have warned me in advance. That picture…😎😱

featured_speaker

Anyways, clicking on the link from from my little speaker square, the one saying “See all sessions from this speaker”, currently shows me as having one talk. A Hands-on-Lab. This is not correct.

Here are the sessions (at JavaOne and OOW) where I will be speaking this year:

Session Title

Session ID

Date

Start Time

End Time

Room

Create a Robot and Bring it to Life KID7398 2017-09-30
(Saturday)
13:00 15:00 Hilton San Francisco Union Square – Continental Ballroom 2/3
Distributed JVM Monitoring and Profiling Made Simple CON6836 2017-10-03
(Tuesday)
8:30 9:15 Moscone West – Room 2022
Distributed Application Diagnostics Made Simple in Next-Gen Oracle Cloud CON6529
(OOW)
2017-10-03
(Tuesday)
12:45 13:30 Moscone West – Room 3924
From Concept to Robotic Overlord with Robo4J CON3021 2017-10-03
(Tuesday)
15:00 15:45 Moscone West – Room 2009
Java Flight Recorder in JDK 9/Java Mission Control 6 HOL3018 2017-10-04
(Wednesday)
13:30 15:30 Hilton San Francisco Union Square (Lobby Level) – Golden Gate 4/5

Looking forward to seeing you at JavaOne/Oracle Open World! Smile

Magnetometer Calibration in Robo4J

This article will explain how to calibrate your magnetometer in Robo4J. This will be required if you want to get as precise results as possible from your magnetometer.

Earth’s magnetic field can be distorted in various ways. If there is no distortion, rotating your magnetometer 360 degrees around the  Z-axis would result in a perfect circle (in the XY plane) centered around the origo. If there is distortion, the circle could be offset or even turned into a tilted ellipse.

There are two different type of distortions commonly discussed:

    1. Hard iron
    2. Soft iron

Hard iron effects are caused by a constant additive field, for example by a magnet. As long as the magnet stays put, relative to the magnetometer, the effect will be constant. This is what we call “bias” in Robo4J.

Soft iron effects are caused by materials that can influence the magnetic field, but which do not necessarily emit a magnetic field. For example iron and nickel. These effects are more complicated and typically turn that perfect circle (from the example above) into an ellipse.

Now, since we are dealing with a 3D magnetometer here, we are really talking about trying to turn an ellipsoid at an offset to origo, into a sphere centered around origo.

So, this is how to calibrate a magnetometer in Robo4J:

    1. Gather data from your magnetometer.
    2. Calculate the bias vector and transform matrix.
    3. Use the calculated bias vector and transformation matrix when instantiating your magnetometer.

Getting Data

If you have an Adafruit 10 DOF breakout board, or an LSM303 device, you are in luck. This is the first magnetometer we support in Robo4J, but we will add more devices as we go. This blog will talk about how to do the calibration given this device.

    1. First, clone robo4j from github
    2. Next build and install robo4j:
      ./gradlew install

    3. Next source the script with the environment variables:
      source /scripts/rpi/environment.sh

    4. Then run the test program, with CSV as output format, and redirect the output to a file:
      java -cp $ROBO4J_PATH com.robo4j.hw.rpi.i2c.magnetometer.MagnetometerLSM303Test 20 1 CSV > /home/pi/magnetometer.csv

It is important that you try to hit as many points as possible, so rotate that thing like there is no tomorrow. I built a simple calibration tool that can help a little bit (but only with one axis). I have been thinking about building a massive one, using three slip rings and ball bearings, but since it would have to be large enough to accept a full sized robot to be truly useful, I know building one would put an unnecessary strain on my marriage. Smile with tongue out

Calculate the Bias Vector and Transform Matrix

This sounds hard, but is rather easy, as we’ve already added a very spiffy application to Robo4J for both visualizing your magnetometer data, and for calculating the bias vector and transform matrix. It is located in the robo4j-tools repo. Simply build and run it with your file as argument.

This is what it will look like when you start it:

raw

If you have some spurious weird values, you may want to filter out the ones that stand out the most. Simply flip the Filter panel open, and click Filter Points. By default the values within 1.0 standard deviation (range from calculated center) will be kept. You can play with the Stddev value to get the result you want.

You can also show what the result would look like if corrected with the Bias Vector and Transformation Matrix, by clicking the “Corrected” checkbox in the Data Selection pane:

corrected

The visualization keep rotating so that the points will be shown alternatively from the XY and the ZY axis.

Using the Data When Instantiating the Magnetometer

In robo4j-hw-rpi the magnetometer can be instantiated with a Tuple3f, and a Matrix3f. Simply instantiate the tuple with the values from the bias vector, and the matrix with the values from the Transform Matrix:

Tuple3f bias = new Tuple3f(-44.689f, -2.0665f, -15.240f);
Matrix3f transform = new Matrix3f(1.887f, 5.987f, -5.709f, 5.987f, 1.528f, -2.960f, -5.709f, -2.960f, 9.761f);
MagnetometerLSM303Device magnetometer = new MagnetometerLSM303Device(I2CBus.BUS_1, 0x1e, Mode.CONTINUOUS_CONVERSION, Rate.RATE_7_5, false, bias, transform);

Summary

This blog explained how to use the Robo4J MagViz tool to calibrate a magnetometer.