Since this month is Hacktoberfest, I thought it would be a good idea to talk a bit about how to contribute to the OpenJDK Mission Control project. Some of the content of this blog post will be applicable to any of the OpenJDK projects, especially the Skara (OpenJDK on Git) bits.
The OpenJDK Mission Control Project
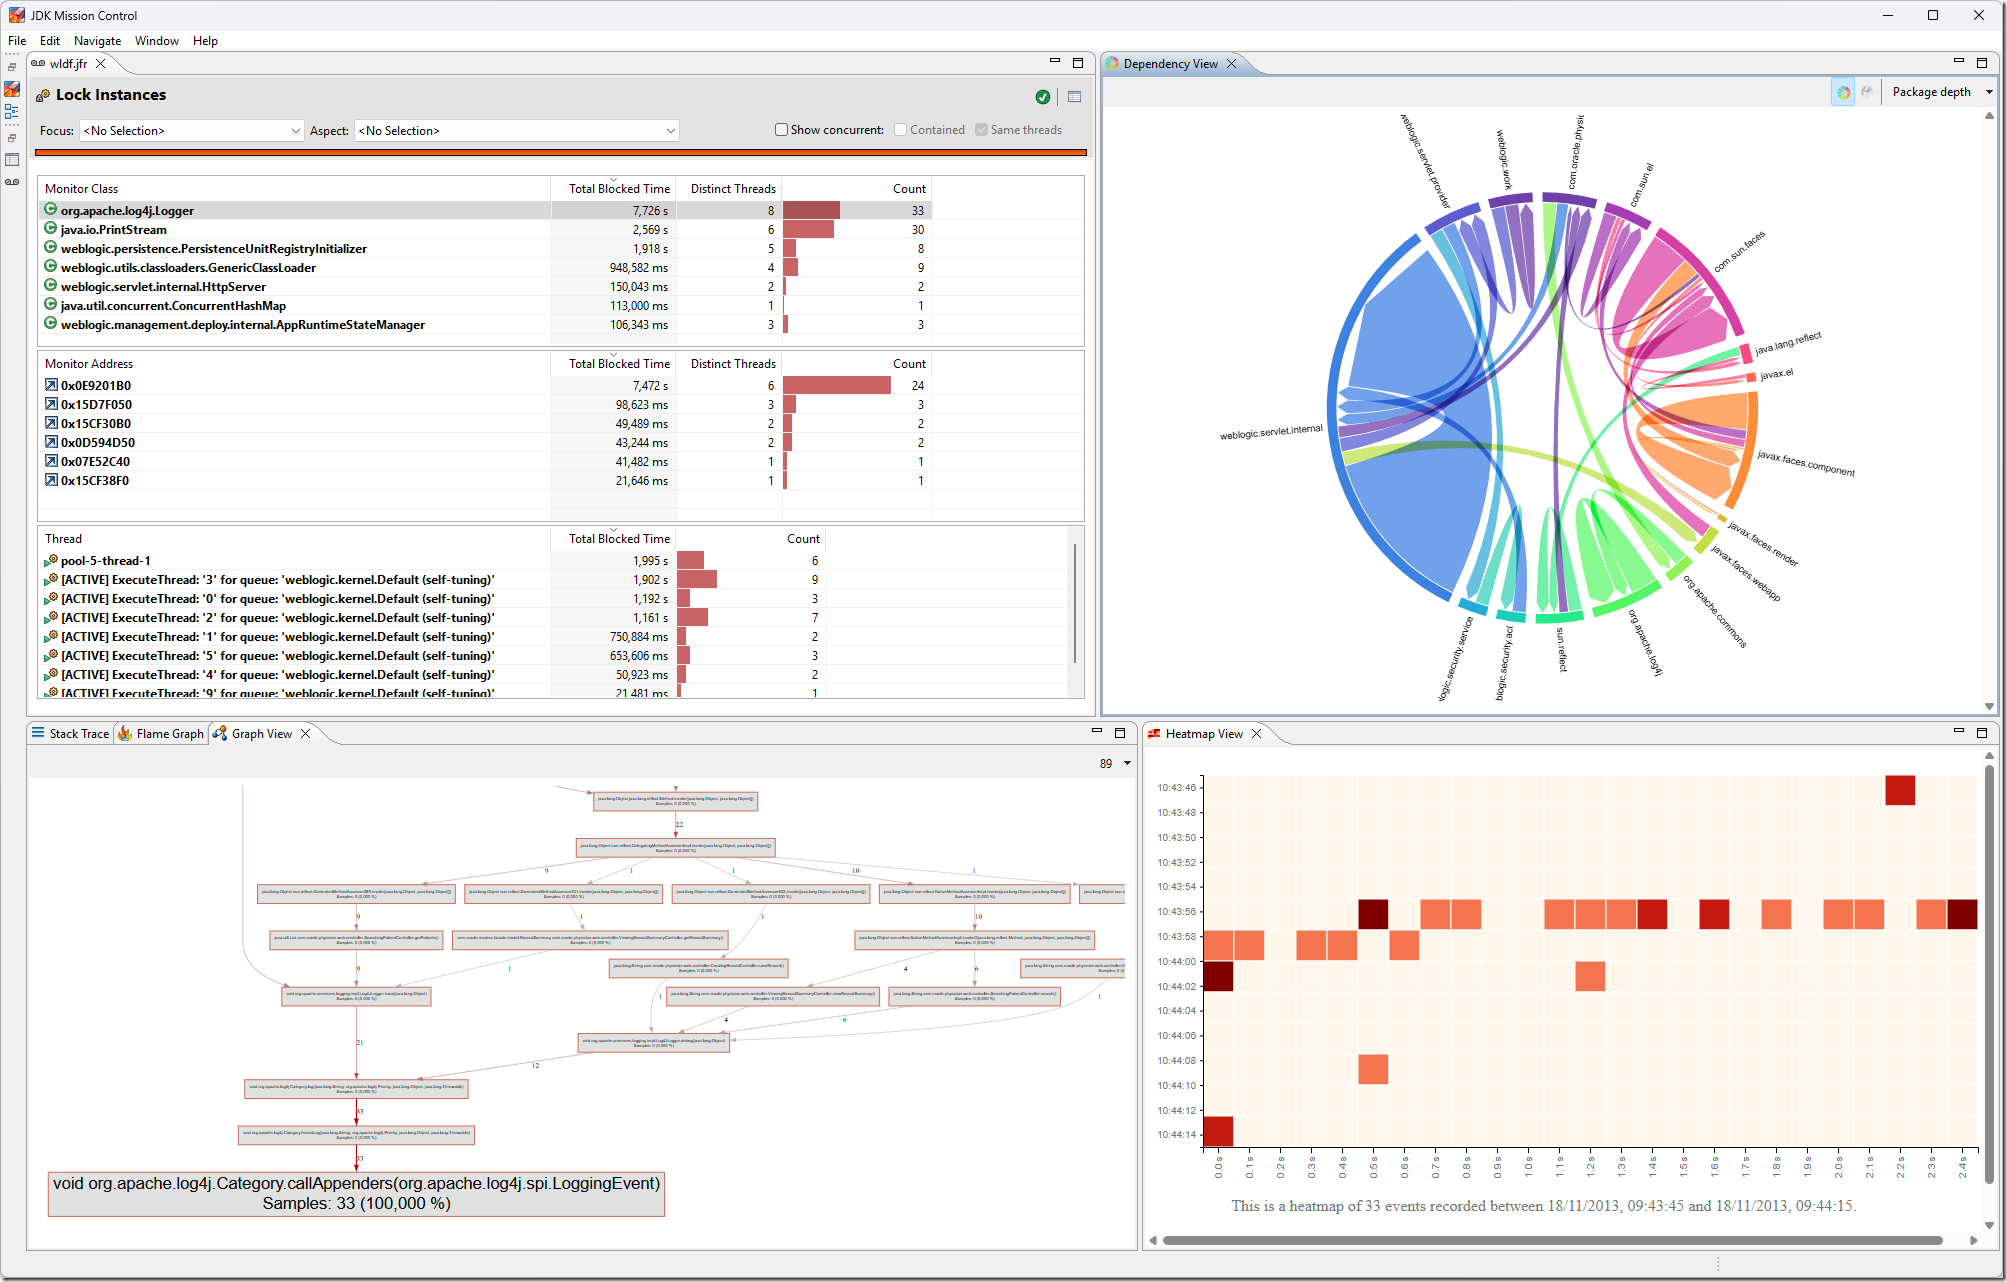
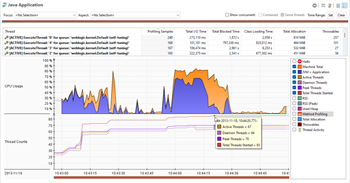
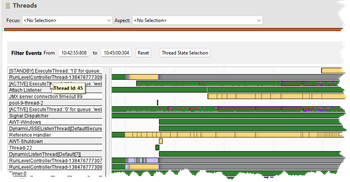
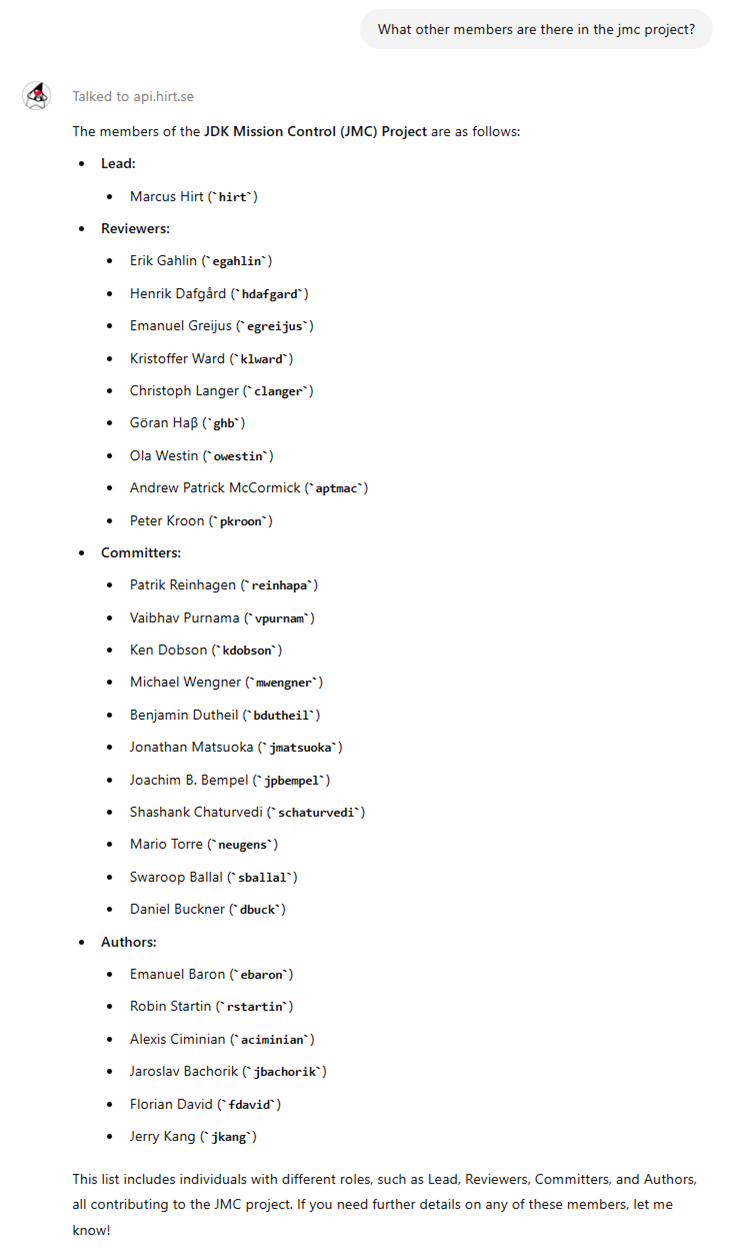
The OpenJDK Mission Control project is the observability tools suite for OpenJDK. It contains a JMX Console,  a JFR visualizer and analyzer, a heap waste analysis tool, and many other little useful tools and utilities. Since it is all open source, pretty much anyone can contribute to the project.
The project is on GitHub:
https://github.com/openjdk/jmc
The first step to contribute to JDK Mission Control is to simply fork the repository on GitHub. This establishes a copy of the repository where you can freely make changes as you please. Whilst it is technically possible to make the changes in the master branch, it will save time and effort if you later want to contribute the effort to make the changes in a branch:
git checkout -b my-jmc-test
Building JMC
First of all, ensure that you have jdk11 active in your shell, and verify that this is the case using:
java -version
There are multiple ways to build JMC. The easiest way is to simply use the build script (don’t do this just yet):
./build.sh –packageJmc
There is also a way to build JMC using Docker (don’t do this just yet either):
docker-compose -f docker/docker-compose.yml run jmc
These are however not the best ways when you’re developing JMC using an IDE. The third party dependencies for JMC need to be available through a p2 repository, and you want to install a build of the JMC core libraries into your maven cache.
So, to set things properly up for development, it is better to first install the core libraries:
cd $JMC_ROOT/core
mvn install
Next, build the p2 site and start jetty to expose it on a well known port:
cd $JMC_ROOT/releng/third-party
mvn p2:site
mvn jetty:run
Then leave jetty running for as long as you are developing JMC. You will need it up and running so that it can be found both when building from the command line, as well as when compiling JMC from within the Eclipse development environment.
To build the JMC application, next do the following in a separate shell (since you have jetty with the p2 site for the third-party dependencies up and running in the previous one):
cd $JMC_ROOT
mvn package
After this, you can use the build script to run the built JMC product:
./build.sh –run
For alternative ways of launching JMC, see the platform specific documentation in the README.md.
Developing JMC
Many that I’ve talked to, especially when JMC was shipped with the Oracle JDK, believed that JMC is a native application. If you’ve browsed the repo, you’ve already seen that it is a Java application, more specifically an Eclipse RCP application. Since it is an Eclipse RCP application, it’s easiest to develop JMC using Eclipse.
First set up your development environment, following the Developer Guide. It is slightly involved, but luckily does not need to happen very often.
Next, in your branch in your fork, commit the changes you want to contribute, and create a pull request, just like you would for any other open source project on GitHub.
Now, if this is your first OpenJDK PR, the OpenJDK bot will likely complain about a few different things, for example:
- You need to have your GitHub account associated with a company that has a signed Oracle Contributor Agreement (OCA), or you must have signed an OCA yourself.
- The PR needs to have an associated issue in the Java Bug System.
- There is some problem with the testing or formatting of your code.
Let’s take a quick look at these three problems.
The Oracle Contributor Agreement
Like all open source projects, there needs to be a Contributor Agreement in place. This is to protect everyone backing the project, as well as the customers depending on the project. For example, the contributor agreement ensures that the source code you’re contributing isn’t violating any patent rights, and that the source code you’re contributing is yours to contribute.
Many larger companies already have an OCA signed, so the first step might be to check with your company if one is already signed. In my case, I both have a personal OCA signed (since I was contributing before Datadog signed an OCA), and one signed by my employer, Datadog.
You will know that the OCA status is not properly set up for your GitHub account when the OCA label is set in the PR, and the following text can be found in the PR:
⚠️ OCA signatory status must be verified
The OpenJDK bot will write helpful messages in the PR to help guide you through getting your OCA status verified.
The Java Bug System
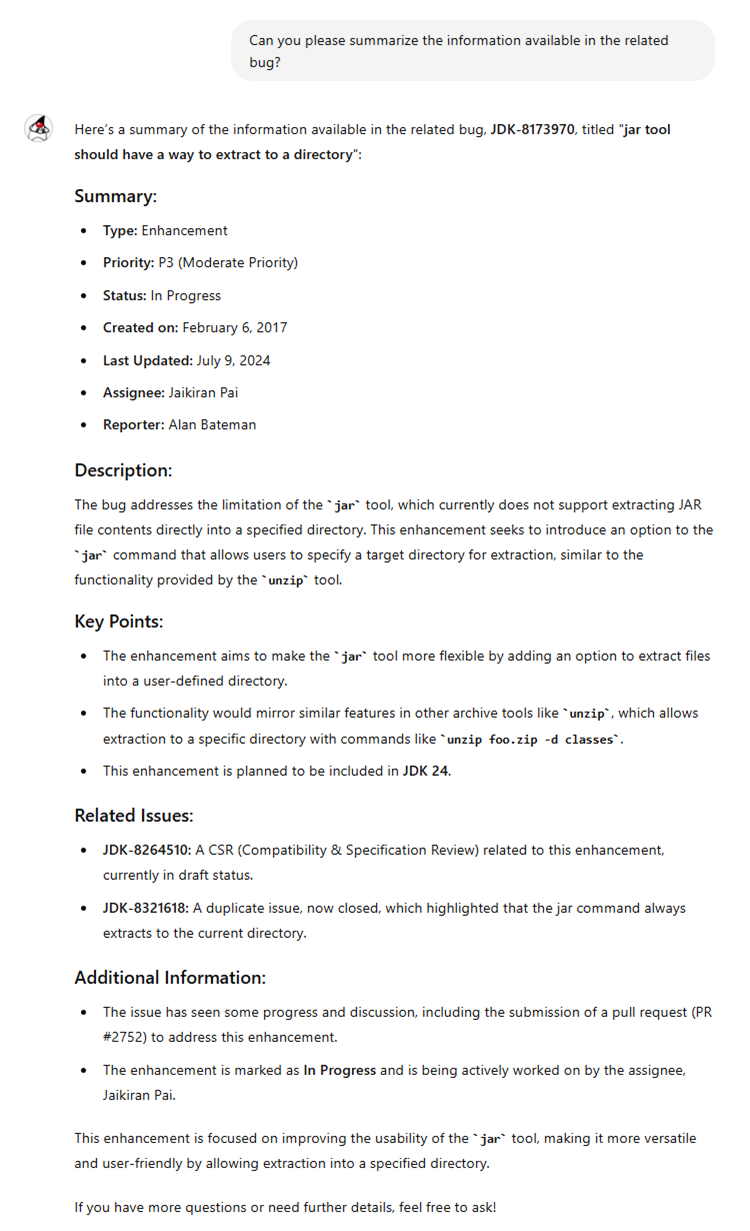
Once you have a few commits under your belt, and become an OpenJDK author, you have access to the Java Bug System (JBS): https://bugs.openjdk.java.net/. So, what do you do before then? If the PR passes a first cursory check by the reviewers, a reviewer will simply create an Issue in JBS for you.
Fixing Issues
If you end up having an issue, the details of the test run in the PR will hopefully be enough to sort it out. If not, you can run mvn verify locally and look at the test logs. If it is formatting, then check if the formatting problem was in core or not, and either run mvn spotless:apply in core or in the root of the project.
Skara – the OpenJDK Git Tooling
Skara is the project name for the tooling around developing OpenJDK on Git(Hub). It actually insulates a lot of the GitHub specifics, making it possible, should the need ever arise, to move the development and development process somewhere else. The project also contains the aforementioned bot that helps, for example, to verify that there is a related JBS issue, and that there is a signed OCA. Skara also contains some useful git extensions which make working with OpenJDK on GitHub smoother.
To set things up, do the following:
Clone Skara:
git clone https://github.com/openjdk/skara
Build it:
gradlew (win) or sh gradlew (mac/linux)
Install it:
git config –global include.path “%CD%/skara.gitconfig” (win), or
git config –global include.path “$PWD/skara.gitconfig” (mac/linux)
Set where to sync your forks from:
git config –global sync.from upstream
Here are some examples:
To sync your fork with upstream and pull the changes:
git sync –pull
Note: if the sync fails with the error message “No remote provided to fetch from, please set the –from flag” or “error: upstream is not a known git remote, nor a proper git URI”, remember to set the remote for your repo, e.g.
git remote add upstream https://github.com/openjdk/jmc
To list the open PRs:
git pr list
To create a PR:
git pr create
To push your committed changes in your branch to your fork, creating the remote branch:
git publish
So, the normal workflow when working with OpenJDK JMC using the Skara tooling becomes:
Note: First ensure that you have a fork of JMC, and that your current directory is the root of that fork. You typically just create that one fork and stick with it.
- (Optional) Sync up your fork with upstream:
git sync –pull
- Create a branch to work on, with a name you pick, typically related to the work you plan on doing:
git checkout –b <branchname>
- Make your changes / fix your bug / add amazing stuff
- (Optional) Run jcheck locally:
git jcheck local
- Push your changes to the new branch on your fork:
git publish (which is pretty much git push –set-upstream origin <branchname>)
- Create the PR, either on GitHub, or from the command line:
git pr create
Once the PR is created, the bot will check that everything is okay, and the PR will be reviewed.
Interacting with the Skara Bot
Getting the PR merged is handled a bit differently in OpenJDK compared to normal GitHub projects. First of all, all the prerequisites must first be fulfilled, like the OCA status of the contributor being verified, the change being properly reviewed, jcheck passing, the tests passing, the PR having a matching issue in JBS etc. Once that is all taken care of, the bot will helpfully ask, in a message in the PR, for the author of the PR to integrate the changes. This is simply done by typing /integrate in message in the PR. The bot will automatically rebase on the latest changes in the target branch (normally master) and squash your commits. In other words, it is perfectly fine to have multiple fixes and other commits happening in the PR after the initial commit for the PR. It is actually much preferred to force-updating the PR, as it’s easier to follow along with the review.
If the PR author is not a committer on the project, the bot will inform that the PR is ready to be sponsored by a committer, which is normally done by the reviewer of the PR. This is done by writing /sponsor in a separate message in the PR.
When the PR is merged, the corresponding JBS issue is automatically closed.
Other Related Repos
There are a few additional repos that are related to the OpenJDK JMC project, but that aren’t currently OpenJDK projects. Two examples are the jmc-jshell and the jmc-tutorial repositories. The jmc-tutorial is a good resource for learning about JDK Mission Control. Even though it is not officially an OpenJDK repository, it can still be a good place to start contributing to the OpenJDK JMC community.
Summary
- Contributing to OpenJDK is easier than ever before now that it’s on GitHub.
- Skara makes it even easier.
- It’s Hacktoberfest – commits to the JMC project (and related repos) count!
- JBS is a good source for JMC starter bugs.
- If you need any help, the JDK Mission Control slack is a good place for asking questions! Ping me or any of the JMC folks for an invite. 🙂
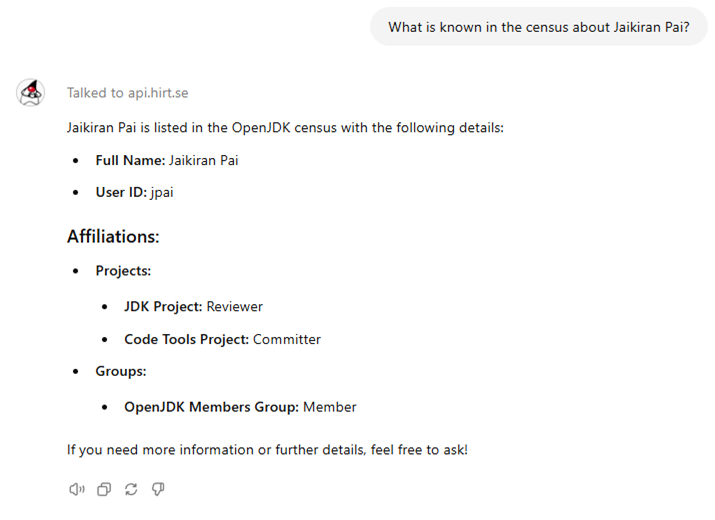
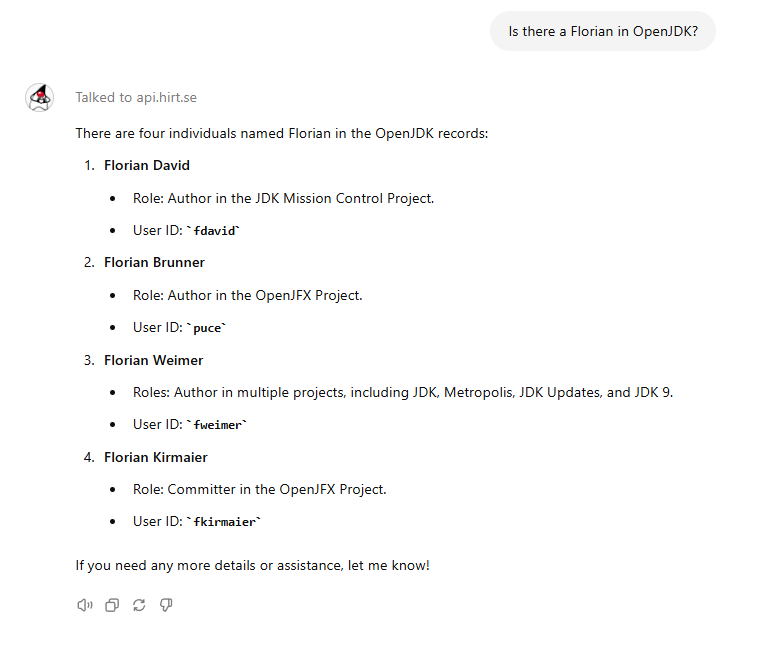
- Finally, here’s a practical guide to OpenJDK projects and the roles:
OpenJDK Projects (java.net)
![]()









![jmc[1] jmc[1]](https://hirt.se/blog/wp-content/uploads/2022/11/jmc1.png)
![eclipse[1] eclipse[1]](https://hirt.se/blog/wp-content/uploads/2022/11/eclipse1.png)


