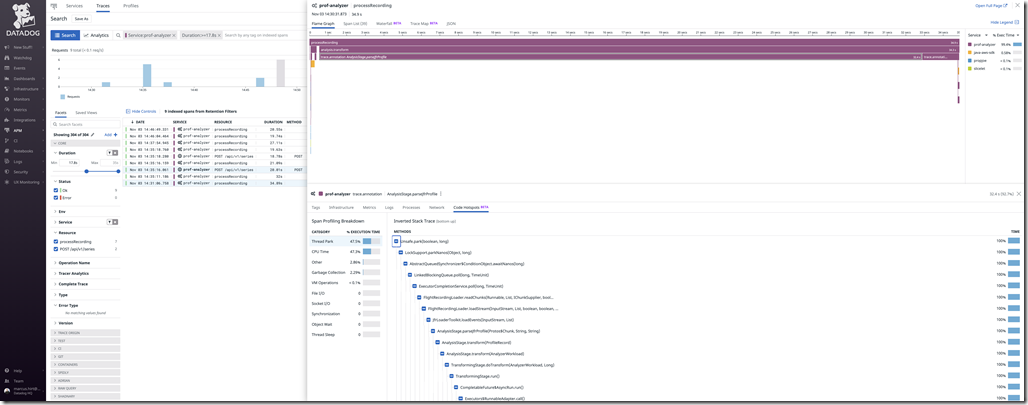
I’ve gotten a lot of questions about continuous production profiling lately. Why would anyone want to profile in production, or, if production profiling seems reasonable, why the heck leave it on continuously? I thought I’d take a few moments and share my take on the problem and the success I’ve seen the past years applying continuous production profiling in systems in the real world.
Trigger warning: this blog will not contain code samples. 😉
Profiling?
So what is software profiling then? It’s the ancient black magic art of trying to figure out how something is performing, for some aspect of performing. In American TV-series, the profiler is usually some federal agent who is adept at understanding the psychology of the criminal mind. The profiler attempts to understand key aspects of the criminal to make it easier for the law enforcement agents to catch him. In software profiling we’re kind of doing the same thing, but for software – your code as well as all the third party code you might be depending on.
We’re trying to build an accurate profile of what is going on in the software when it is being run, but in this case to find ways to improve a program. And to understand what is going on in your program, the profiler has to collect call traces and usually some additional context to make sense of it all.
In comparison to other observability tools, like metrics and logs, profilers will provide you with a holistic view of a running program, no matter the origin of the code and requiring no application specific instrumentation. Profilers will provide you with detailed information about where in the actual code, down to the line and byte code index, things are going down. A concrete example would be learning which line in a function/method is using most of the CPU, and how it was being called.
It used to take painting a red pentagram on the floor, and a healthy stock of black wax candles, to do profiling right. Especially in production. Overhead of early profilers weren’t really a design criteria; it was assumed you’d run the process locally, and in development. And, since it was assumed you’d be running the profiling frontend on the same machine, profiling remote processes were somewhat tricky and not necessarily secure. Production profilers, like JFR/JMC came along, but they usually focus on a single process, and since security is a bit tricky to set up properly, most people sidestep the problem altogether and run (yep, in production) with authentication and encryption off.
Different Kinds of Profiling
Profiling means different things to different people. There are various types of resources that you may be interested in knowing more about, such as CPU or locks, and there are different ways of profiling them.
Most people will implicitly assume that when talking about profiling, one means CPU-profiling – the ancient art of collecting data about where in the code the most CPU-time is spent. It’s a great place to start when you’re trying to figure out how to make your application consume less CPU. If you can optimize your application to do the same work with less resources, this of course directly translates into lowering the bill to your cloud provider, or being able to put off buying those extra servers for a while.
Any self-respecting modern profiling tool will be able to show more than just the CPU aspect of your application, for example allocation profiling or profiling thread halts. Profiling no longer implies just grabbing stack-traces, and assigning meaning to the stack trace depending on how it was sampled; some profilers collaborate closely with the runtime to provide more information than that. Some profilers even provide execution tracing capabilities.
Execution tracing is the capability to produce very specific events when something interesting happens. Execution tracing is available on different levels. Operating systems usually provide frameworks allowing you to listen on various operating system events, some even allowing you to write probe definitions to decide what data to get. Examples include ETW, DTrace and eBPF. Some runtimes, like the OpenJDK Java VM, provide support for integrating with these event systems, and/or have their own event system altogether. Java, being portable across operating systems, and wanting to provide context from the runtime itself, has a high performance event recorder built in, called the JDK Flight Recorder. Benefits include cheap access to information and emission of data and state already tracked by the runtime, not to mention an extensible and coherent data model.
Here are a few of my favourite kinds of profiling information:
- CPU profiling
- Wall-clock profiling
- Allocation profiling
- Lock / Thread halt / Stop-the-World profiling
- Heap profiling
Let’s go through a few of them…
CPU Profiling
CPU profiling attempts to answer the question about which methods/functions are eating up all that CPU. If you can properly answer that question, and if you can do something about it (like optimizing the function or calling it less often) you will use less resources. If you want to reduce your cloud provider bill, this is a great place to start. Also, if you can scope the analysis down to a context that you care about, let’s say part of a distributed trace, you can target improving the performance of an individual API endpoint.
Wall-Clock Profiling
Wall-clock profiling attempts to answer the question about which method/function is taking all that time, no matter if on CPU or not. For runtimes supporting massively multithreaded applications, this information is much less useful without some context.
For example, let’s say you have a Java application with various thread pools running various kinds of operations. You may have hundreds of threads, all of them mostly parked, awaiting some work to do. Unless you have some context, all the wall-clock profiling will tell you is that most threads were parked. But if you do have some context, let’s say context around which span in a distributed trace is running when samples are taken, your wall-clock profiling data can tell you in which methods most of the time was spent during a particularly long lasting span. [1]
As a general rule of thumb, wall-clock profiling is useful for finding and optimizing away latencies, whereas CPU profiling is more suited for optimizing throughput. Also, execution tracing is a great complement to wall-clock profiling.
If you can tell where the wall-clock time is spent, you can help remove performance obstacles by seeing which method calls take time and optimize them, or reduce the number of calls to them.
Allocation Profiling
Allocation profiling is trying to answer where all that allocation pressure is coming from, and from allocating what. This is important, since all that allocated memory will usually have to be reclaimed at some point in time, and that uses both CPU and possibly causes stop-the-world pauses from GC (though modern GC technologies, for example ZGC for the Java platform, is making this less of an issue for some types of services).
If you can properly answer where the allocation pressure comes from, you can bring down GC activity by optimizing the offending methods, or have your application call them less.
Lock / Thread Halt / Stop-the-World (STW) Profiling
This kind of profiling tries to answer the question about why my thread didn’t get to run right there and right then. This is typically what you would use the wall-clock-profiler for, but the wall-clock-profiler usually has some serious limitations, making it necessary to collaborate with the runtime to get some additional context. The wall-clock profiler typically only gets sampled stack traces showing you which method you spent time in, but without context it may be hard to know why.
Here are some examples:
- Your thread is waiting on a monitor
Context should probably include which thread is currently holding the monitor, which address the monitor has, the time you had to wait etc.
- Your runtime is doing something runtimey requiring stopping the world, showing your method taking its own sweet time, but not offering any clues as to why
- STW phase due to GC happening in the middle of running your method.
- STW phase due to a heap dump
- STW phase due to full thread stack dump
- STW phase due to bad behaving framework, or your well meaning colleague(s), forcing full GCs all the time, since they “know that a GC really improves performance if done right there”, not quite realizing that it’s just a small part of a much bigger system.
- Your thread is waiting for an I/O operation to complete
Context should probably include the IP address (socket I/O) or file (file I/O), the bytes read/written etc.
There are plenty of more examples, wait, sleep, park etc. To learn more, open JDK Mission Control and take a look at individual event types in the event browser.
Heap Profiling
This kind of profiling attempts to answer questions about what’s on your heap and, sometimes, why. This information can be used to reduce the amount of heap required to run your application, or help you solve memory leaks. Information may range from heap histograms showing you the number of instances of each type on the heap, to leak candidates, their allocation times and allocation stack traces, together with the reference chains still holding on to them.
Continuous Production Profiling
Assuming that your application always has the same performance profile, which implies always having exactly the same load and never being updated, with no edge cases or failure modes, and assuming perfectly random sampling, your profiler could simply take a few samples (let’s say 100 to get a nice distribution) over whichever time period you are interested in (let’s say 24 hours), and call it a day. You would have a very cheap breakdown over whatever profiling information you’re tracking.
These days, however, new versions of an application are deployed several times a day, evolving to meet new requirements at a break-neck speed. They are also subjected to rapidly changing load profiles. Sometimes there may be an edge case we didn’t foresee when writing the program. Being able to use profiling data to not only do high level performance profiling, but detailed problem resolution, is becoming more and more common, not to mention useful.
At Datadog, we’ve used continuous production profiling for our own services for many months now. The net result is that we’ve managed to lower the cost of running our services all over the company by quite large amounts of money. We’ve even used the profiler to improve our other components, like the tracer. I had the same experience at Oracle, where dedicated continuous profiling analysis was used to a great extent for problem resolution in production systems.
Aside from being incredibly convenient, there are many different reasons why you might want to have the profiler running continuously.
Change Analysis
These days new versions are deployed several times a day. This is certainly true for my team at Datadog. There is great value in being able to compare the performance profile, down to the line of code. This is true across new releases, specific time intervals, over other attributes like high vs low CPU load, and countless other facets.
Fine Grained Profiling
Some production profiling environments allow you to add context, for example custom events, providing the means to look at the profiling data in the light of something else happening in a thread at a certain time. This can be used for doing breakdowns of the profiling data for any context you put there, any time, anywhere.
Adding some contextual information can be quite powerful. For example, if we were able to extend the profiling data with information about what was actually going on in that thread, at that time, any other profiling data captured could be seen in the light of that context. For example, WebLogic Server produced Flight Recorder Events for things like SQL calls, servlet invocations etc, making it much easier to attribute the low-level information provided by the profiler to higher level constructs. These events were also associated with an Execution Context ID which spanned processes, making it possible to follow along in distributed transactions.
With the advent of distributed tracing, this can be done in a fairly general way, so that profiling data can be associated with thread local activations of spans in a distributed trace (so called scopes). [1]
That said, with a general recording framework, there is no limit to the kinds of contexts you can invent and associate your profiling data with.
Diagnostics
It’s 2:03 a.m., all of a sudden some spans in your distributed trace end up taking a really long time. Looking at the spans, there is nothing indicating something is actually going wrong, or that the data is bad. From what is present in the tag data, nothing seems to be related between the spans. You decide to open up the profile.
The automated analysis informs you that a third-party library has initiated safe pointing VM operations from a certain thread, in this case for doing full heap dumps. The analysis text points you to more documentation about what a safe point is. You read up on safe pointing VM operations, and the library, and find out that under certain conditions, the library can initiate an emergency heap dump, but that the feature can be turned off. You turn it off, redeploy and go back to sleep.
Or, perhaps the automated analysis informs you that there is heavy lock contention on the apache logger, and links you to the lock profiling information. Looking at the lock profiling information, it seems most of the contention is being caused by the logging done on one particular line. You decide that the logging there is not essential, remove it, commit, redeploy and go back to sleep.
When something happens in production, you will always have data at hand with a continuous profiler. There is no need to try to reproduce the exact environment and conditions under which the problem occurs. You will always have actionable data readily available.
Of course, the cure must not be worse than the ailment. If the performance overhead you pay for the information costs you too much, it will not be worth it. Therefore this rather detailed information must be collected quite inexpensively for a continuous production profiler.
Low-overhead Production Profiling
So, how can one go about producing this information at a reasonable cost? Also, we can’t introduce too much observer effect, as this will skew the data, and not truly represent the application behaviour without the instrumentation.
There are plenty of different methods and techniques we can use. Let’s dig into a few.
Using Already Available Information
If the runtime is already collecting the data, exporting it can usually be done quite cheaply. For example, if the runtime is already collecting information about the various garbage collection phases, perhaps to drive decisions like when to start initiating the next concurrent GC-cycle, that information is already readily available. There is usually quite a bit of information that an adaptively optimizing runtime keeps track of, and some of that information can be quite useful for application developers.
Sampling
One technique we can use is to not take every single possible value, but do statistical sampling instead. In many cases this is the only way which makes sense. Let’s take CPU profiling for example. In most cases, we will be able to select an upper boundary for how much data we produce by either selecting the CPU quanta between samples, or by selecting a fixed number of threads to look at any given time and the sampling period. There are also more advanced techniques for getting a fixed data rate.
An interesting example from Java is the new upcoming allocation profiling event. Allocation in Java is most of the time approximately the cost of bumping a pointer. The allocation takes place in thread local area buffers (TLABs). There is no way to do anything in that code path without introducing unacceptable overhead. There are however two “slow” paths in the allocator. One for when the TLAB is full. The other one for when the object is too large to fit in a TLAB (usually by allocating an enormous array) leading to the object being allocated directly on heap. By sampling our allocations at these points, we get relatively cheap allocation events that are proportional to the allocation pressure. If we were able to configure how often to subsample over the average amount of memory allocated between samples, we would be able to regulate the acceptable overhead. That said, what we’re really looking for is a constant data production rate, so regulating that is better left to a PID-style controller, giving us a relatively constant data production.
Of course, the less sample points we have, the less we can say about the behaviour over very short periods of time.
Thresholding
One sort of sampling is to simply only collect outliers. For some situations, we really would like to get more information. One example might be thread halts that take longer than, say, 10ms. Setting a threshold allows us to do a little bit of more work, when it’s very much warranted. For example, I might only be interested in tracking blocking I/O reads/writes lasting longer than a certain threshold, but for them I’d like to know the amount of bytes read/written, the IP address read from/written to etc.
Of course, the higher the threshold, the more data we will miss (unless we have other means to account for that time). Also, thresholds make it harder to reason about the actual data production rate.
Protect Against Edge Cases
Edge cases which make it hard to reason about their potential overhead should be avoided, or at least handled. For example, when calculating reference chains, you may provide a time budget for which you can scan, and then only do it when absolutely needed. Or, since the cost of walking a stack trace can be proportional to the number of frames on the stack, you can set an upper limit to how many frames to walk, so that recursion gone wild won’t kill your performance. Be careful to identify these edge cases, and protect against them.
One recent example is the Exception event available in the Flight Recorder (Java), which can be configured to only capture Errors. The Java Language Specification defines an Error like this:
“Error is the superclass of all the exceptions from which ordinary programs are not ordinarily expected to recover.”
You would be excused for believing that Errors would happen very rarely, and that recording all of them would not be a problem. Well, a very popular Java framework, which will remain unnamed, subclassed Error in an exception class named LookAheadSuccess. That error was used in a parser and used for control flow, resulting in the error being thrown about a gazillion times per minute. We ended up developing our own solution for exception profiling at DD, which records Datadog specific events into the JDK Flight Recorder.
Some Assembly Required
These techniques, and more, can be used together to provide a best-of-all-worlds profiling environment. Just be careful, as with most things in life a balance must be found. Just like there is (trigger warning) no single energy source that will solve our energy problems in a carbon neutral way (we should use all at our disposal – including nuclear power – to have a chance to go carbon neutral in a reasonable time [2][3]), a balance must be struck between sampling and execution tracing, and a balance for how much data to capture for the various types of profiling you’re doing.
Continuous Profiling in Large Deployments
Or, Finding What You’re Looking For
In a way this part of the blog will be a shameless plug for the work I’ve been involved with at Datadog, but it may offer insights into what matters for a continuous profiler to be successful. Feel free to skip if you dislike me talking about a specific commercial solution.
So, you’ve managed to get all that juicy profiling down to a reasonable amount of data (for Datadog / Java, on average about 100k events per minute, with context and stacktraces, or 2MB per minute, at less than 2% CPU overhead), that you can process and store without going broke. What do you do next?
That amount of data will be overwhelming to most people, so you’ll need to offer a few different ways into the data. Here are a few that we’ve found useful at Datadog:
- Monitoring
- Aggregation
- Searching
- Association by Context
- Analysis
Monitoring
All that detailed data that has been collected can, of course, be used to derive metrics. We differentiate between two kinds in the profiling team at Datadog:
- Key Performance Metrics
- High Cardinality Metrics
Key performance metrics are simple scalar metrics, you typically derive a value, periodically, per runtime. For example CPU utilization or allocation rate.
Here’s an example showing a typical key performance metric (note that all pictures are clickable for a better look):

The graph above shows the allocation rate. It’s a simple number per runtime that can change over time. In this case the chart is an aggregate over the service, but it could just as well be a simple metric plotted for an individual runtime.
High Cardinality Metrics are metrics that can have an enormous amount of different buckets with which the values are associated with. An example would be the cpu time per method.
We use these kinds of metrics to support many different use cases, such as allowing you to see the hottest methods in your entire datacenter. The picture below shows the hottest allocation sites across a bunch of processes.

Here are some contended methods. Yep, one is a demo…

Metrics also allow you to monitor for certain conditions, like having alerts / watchdogs when certain conditions or changes in conditions occur. That said, they aren’t worth that much unless you can, if you find something funny, go see what was going on – for example see how that contended method was reached when under contention.
Aggregation
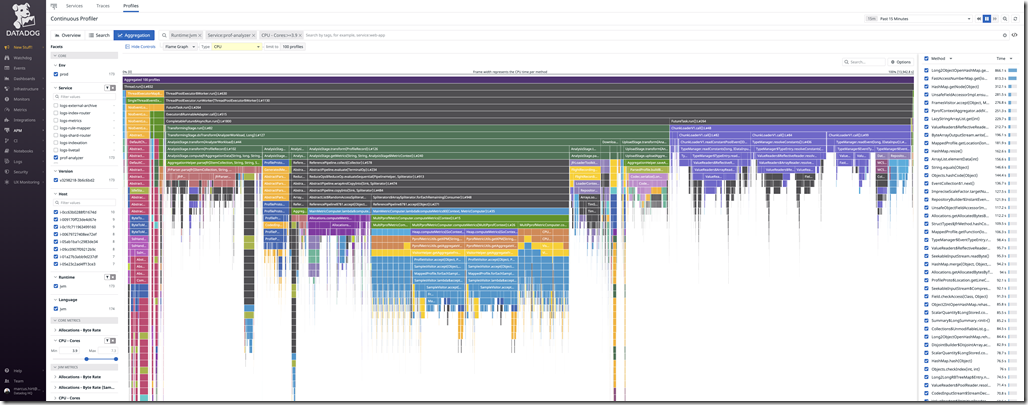
Another use case is when you simply don’t care about a specific use case. You just want to look at the big picture in your datacenter. You may perhaps want to see, on average, across all your hosts and for a certain time range, what the CPU profiling information looks like? This would be a great place to start if, for example, looking for ways to lower the CPU usage for Friday nights, 7 to 10 p.m.
Here, for example, is an aggregation flame graph for the profiling data collected for a certain service (prof-analyzer), where there is some load (I set it to a range to filter out the profiles with very little load).

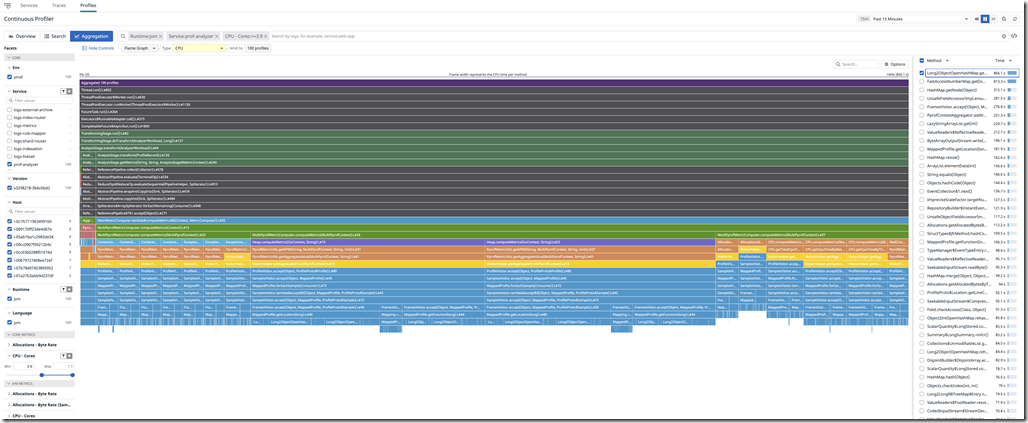
A specific method can be selected to show how that specific method ended up being called:

Searching
What if you just want to get to an example of the worst possible examples of using a butt-load of CPU? Or if you want to find the worst example of a spike in allocation rate? Having indexed key performance metrics for the profiling data makes it possible to quickly search for profiling information matching certain criteria.
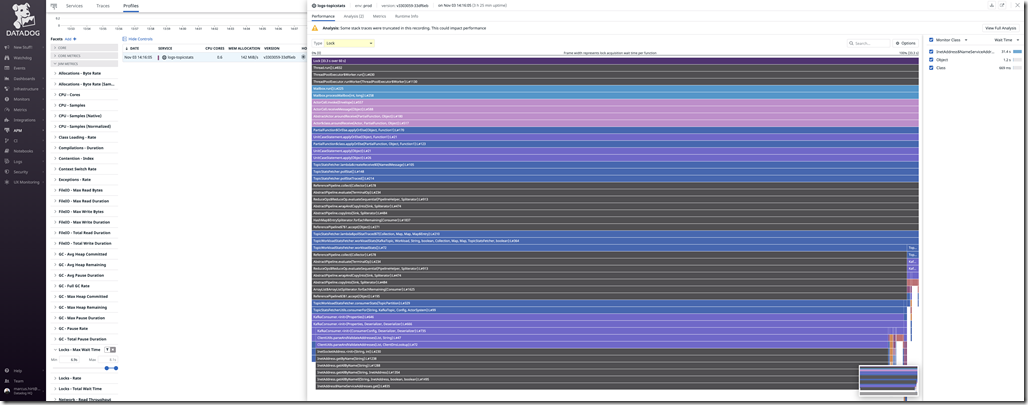
Here is an example of using the monitor enter wait time to filter out an atypically high lock contention:

Association by Context
Of course, if we can associate the profiling data with individual traces, it would be possible to see what went on for an individual long lasting span. If using information from the runtime, even things that are normally hidden from user applications (including profilers purely written in Java), like stop-the-world pauses, would be visible.

Analysis
When having access to all that yummy, per thread and time, detailed, profiling data, it would be a shame to not go looking for some interesting patterns to highlight. The result of that analysis can provide a means to focus on the most important parts of the profiling data.

So, nothing terribly interesting going on in our services right now. The one below is from a silly demo app.

That said, if you’re interested in the kind of patterns we can detect, check out the JDK Mission Control rules. The ones at Datadog are a superset, and work similarly.
Summary
Profiling these days is no longer limited to high overhead development profilers. The capabilities of the production time profilers are steadily increasing and their value is becoming less controversial, some preferring them for complex applications even during development. Today, having a continuous production profiler enabled in production will offer unparalleled performance insights into your production environment, at an impressively low performance overhead. Data will always be at your fingertips when you need it.
Additional Reading
https://www.datadoghq.com/blog/datadog-continuous-profiler/
https://www.datadoghq.com/blog/engineering/how-we-wrote-a-python-profiler/
Many thanks to Alex Ciminian, Matt Perpick and Dan Benamy for feedback on this blog.
—
[1]: Deep Distributed Tracing blog: https://hirt.se/blog/?p=1081
Unrelated links regarding the very interesting and important de-carbonization debate:
[2]: https://theness.com/neurologicablog/index.php/there-is-no-one-energy-solution/
[3]: https://mediasite.engr.wisc.edu/Mediasite/Play/f77cfe80cdea45079cee72ac7e04469f1d
(No longer available, but this youtube clip is related, and also presented by Dr. Jesse Jenkins):
https://youtu.be/ZYfD1Z_zkfc
