
By Marcus Hirt and JP Bempel
Since JDK 14 there is a new JFR kid on the block – JFR streaming. 🙂 This blog post will discuss some of the things that you can do with JFR streaming, as well as some of the things you may want to avoid.
An Introduction to JFR Streaming
In the most recent version of the JDK a new JFR-related feature was introduced – JFR streaming. It is a feature allowing a developer to subscribe to select JFR data and to decide what to do with that data in the host process. JFR events can also be consumed from a separate process by pointing to the file repo of a separate JVM process – the mechanism is the same.
The JFR streaming works by allowing the reading from the JFR file whilst it is being written, the emissions to disk happening more frequently (usually every seconds, or when the in memory buffers are full) than during your normal flight recordings, where the data is emitted when the in-memory buffers are full. It does not support streaming directly from in-memory buffers, and the events are not delivered synchronously when they are occurring in the JVM.
The new functionality mostly resides in jdk.jfr.consumer. This is how you would open an event stream and start consuming the CPU load with 1 second intervals and the monitor class when blocked to enter a monitor for 10 ms:
try (var rs = new RecordingStream()) {
  rs.enable("jdk.CPULoad").withPeriod(Duration.ofSeconds(1));
  rs.enable("jdk.JavaMonitorEnter").withThreshold(Duration.ofMillis(10));
  rs.onEvent("jdk.CPULoad", event -> {
    System.out.println(event.getFloat("machineTotal"));
  });
  rs.onEvent("jdk.JavaMonitorEnter", event -> {
    System.out.println(event.getClass("monitorClass"));
  });
  rs.start();
}
The RecordingStream is what you would use to control what is gathered from within the Java process, effectively also controlling the recorder.
Here is another example using the default recording template, and printing out the information for garbage collection events, cpu load and the JVM information:
Configuration c = Configuration.getConfiguration("default");
 try (var rs = new RecordingStream(c)) {
     rs.onEvent("jdk.GarbageCollection", System.out::println);
     rs.onEvent("jdk.CPULoad", System.out::println);
     rs.onEvent("jdk.JVMInformation", System.out::println);
     rs.start();
   }
 }
The EventStream class can be used together with the standard flight recorder mechanisms to gather information from ongoing recordings, even ones being done in separate processes or an already recorded file. Here is an example using the EventStream to get some other attributes of the CPU load and information from garbage collections from within the Java process (needs an ongoing recording):
try (var es = EventStream.openRepository()) {
   es.onEvent("jdk.CPULoad", event -> {
     System.out.println("CPU Load " + event.getEndTime());
     System.out.println(" Machine total: " + 100 * event.getFloat("machineTotal") + "%");
     System.out.println(" JVM User: " + 100 * event.getFloat("jvmUser") + "%");
     System.out.println(" JVM System: " + 100 * event.getFloat("jvmSystem") + "%");
     System.out.println();
   });
   es.onEvent("jdk.GarbageCollection", event -> {
     System.out.println("Garbage collection: " + event.getLong("gcId"));
     System.out.println(" Cause: " + event.getString("cause"));
     System.out.println(" Total pause: " + event.getDuration("sumOfPauses"));
     System.out.println(" Longest pause: " + event.getDuration("longestPause"));
     System.out.println();
   });
   es.start();
 }
This is the EventStream interface used to consume and filter an event stream:
public interface EventStream extends AutoCloseable {
  public static EventStream openRepository();
  public static EventStream openRepository(Path directory);
  public static EventStream openFile(Path file);

  void setStartTime(Instant startTime);
  void setEndTime(Instant endTime);
  void setOrdered(boolean ordered);
  void setReuse(boolean reuse);

  void onEvent(Consumer handler);
  void onEvent(String eventName, Consumer<RecordedEvent> handler);
  void onClose(Runnable handler);
  void onError(Runnable handler);
  void remove(Object handler);
  void start();
  void startAsync();
  void awaitTermination();
  void awaitTermination(Duration duration);
  void close();
}
The open* methods allow you to open a specific file or a specific file repository (for example from a different process). The set* methods allow you to filter on time and to select if you want to enforce that the events are delivered in time order. You can also allow the reuse of the event object that gets delivered, to get the memory pressure down a bit.
The onEvent* allows you to register a consumer for handling the events, either all of the events or by event name (type). The start method kicks off the processing in the current thread, startAsync is a convenience method for kicking off the process in a single separate thread.
Where to use streaming
There are several advantages to JFR event streaming. It is a great way to access JFR data for monitoring purposes. You get access to detailed information that was previously unavailable to you, even from different processes, should you want to.
Here are some examples:
- Directly send monitoring data to your favourite monitoring service
For example streaming select metrics over to Datadog. 😉 Not that you would need to – we already derive interesting performance metrics from the (full) flight recordings we capture. We even track complex metrics like top hottest methods, or top allocations sites, over time, using what we internally call high cardinality metrics. - Pre-aggregating data before sending it off
For example, you could get the CPU load every second, and then every five minutes roll it up to an average, median, min, max and a standard deviation, not having to send every single entry. - Act on profiling data in-process
You could, for example, make decisions for controlling the normal flight recordings given some statistics you track, like enabling certain events when it looks like it could be interesting. - Expose JFR data through other management APIs
For example, adding an MBean exposing select JFR data over JMX.
That said, there might be an API to directly connect to an MBeanServerConnection directly in the future[1]:MBeanServerConnection conn = connect(host, port); try (EventStream es = new RemoteRecordingStream(conn)) { es.onEvent("jdk.GarbageCollection", e -> ... ); es.onEvent("jdk.ExceptionThrown". e -> ...); es.onEvent("jdk.JavaMonitorBlocked", e-> ...); es.start(); }
It also allows you to skip the metadata part of a normal flight recording. The metadata in JFR contains the information about what was recorded, so that you can parse and view data that you may not even know about beforehand. In the case of monitoring a few well known data points, this is redundant information to keep sending over and over again.
Erik Gahlin has a neat example for producing health reports using JFR streaming, displaying pre-aggregation of the top frames for execution samples and allocation, as well as doing stats for some common data points, like GC metrics and CPU load.
Where Not to Use Streaming
This is from JEP-349[2], the JEP where JFR streaming was introduced:
“To consume the data today, a user must start a recording, stop it, dump the contents to disk and then parse the recording file. This works well for application profiling, where typically at least a minute of data is being recorded at a time, but not for monitoring purposes.“
Let’s explore why the JEP differentiates between monitoring and profiling. Some events in JFR are simple data points in time. Some are more complex, containing plenty of constants. For example stack traces. JFR takes great care to record these complex data structures in a binary format that doesn’t take a lot of processing time to produce, and which is still compact.
Some of the JFR events occur quite frequently – for example, a typical one minute recording of data can contain hundreds of thousands of events. The file size for such a recording is typically only a couple of MB large. There is a mix of techniques used to keep the size down, such as using constant pools to ensure that information like method names are not repeated, LEB128 encoding of integers etc.
For profiling you typically want quite a few of these events enabled. JFR was built to emit this data at a very low overhead, and the data is eminently useful to get detailed information about things like why your thread is halting. For example, the stack trace to a place where your code had to wait to enter a monitor, complete with the class of the monitor waited on, the exact duration of the wait, which thread was holding on to the monitor (making you not able to enter), the monitor address and more. Not only that, there may have been other events providing context about what was going on in that thread at the time of the monitor enter, shining further light on what was going on. Events that you may not even know about.
If using JFR streaming for profiling, you would spend a lot of effort either naively sending constant information over and over again in an inefficient way (say, serializing all of it to JSon), or trying to spend a lot of effort reproducing the JFR format (introducing your own constant pools etc).
For example, the RecordedEvent class contains a method to get the RecordedStackTrace, which is a List of RecordedFrame. For each event you would walk through, the in-memory object model would be created.
You can externalize some of that cost, i.e. how the process you are monitoring is affected, by using another process to read the data as described above. That would, for example, lessen the allocation pressure in the process you’re monitoring. That is great, for example if you have a very latency sensitive process. That said, you have now created another Java process and put the costs over there (including the cpu overhead of dealing with the memory pressure as well as the memory overhead of running another JVM), typically on the same host. If you can afford to dedicate the memory and pin the event stream reader process to its own processor (cpu affinity), this can be a good solution though. Note that the same can be done for normal flight recordings, i.e. you can stream the recorded data directly from the file repository from a separate process.
Benchmarks of Using JFR Streaming Wrongly
For laughs and giggles, here are some benchmarks using just standard JFR to get all the data in the profiling template, compared to getting the equivalent information and serializing it to a JSon-like format using JFR Streaming. In other words, abusing JFR Streaming as a streaming replacement for getting the full JFR dataset. This is of course not what you should be using JFR Streaming for, but exemplifies how wrong you can land if you use the technology in a way it was never intended. We’ll look at the latency of http requests, the CPU time spent and the allocation pressure. We’ll also look at the size of the payload of information extracted. The benchmark is admittedly being a bit extra mean as well, to explore edge cases.
Note that this is a simplified example – we’re not even bothering with extracting the full stacktrace information and re-encoding it for streaming, whilst the JFRs in comparison already contain the full stack traces for all events efficiently encoded in constant pools. We could trade (even more) CPU for trying to bring the streamed data back to a JFR style format with constant pools again before storing/sending it. For serialization we’re simply doing toString() on the event objects, which gives us the events in a JSon-like format with only the top five frames of the stack trace. Including the full stack traces would add quite a bit more overhead to the streaming example.
The benchmark is available in this GitHub repository. It is based on the standard PetClinic application with some modifications to make it relevant to measure overhead in general.
Note: We are using an early access version of OpenJDK 15 in the benchmarks, since we discovered a bug whilst building this benchmark. See JDK-8245120.
The first chart shows the impact on http request latencies:
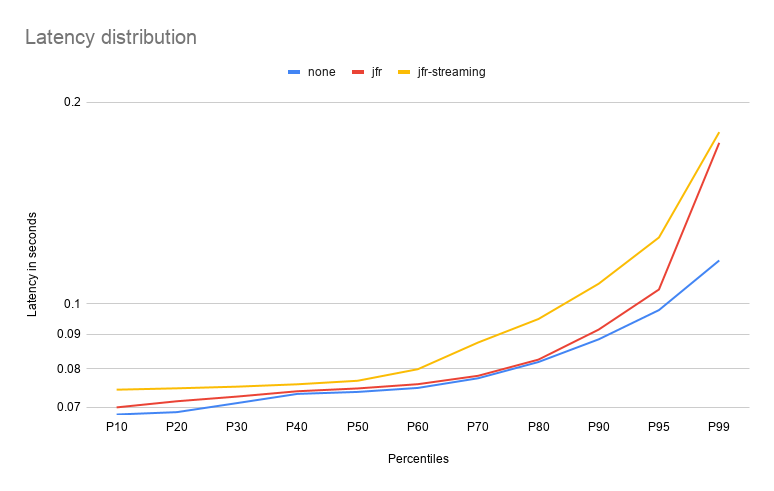
Note: Y-axis is in log scale to magnify the difference.
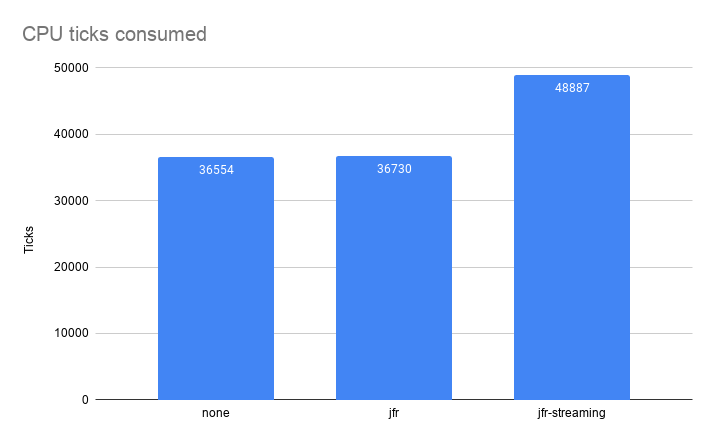
Next chart shows the CPU consumption. We measure in ticks from /proc/<pid>/stat at the end of the benchmark. This way we have a unique number easy to compare with other runs. It represents the CPU consumed when threads were scheduled on the CPU.
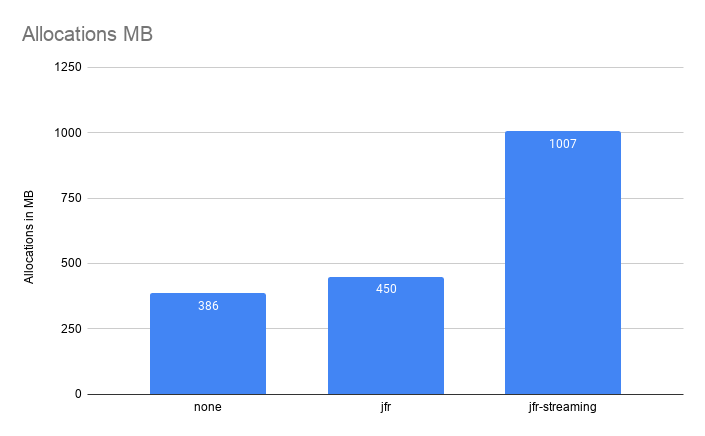
The following chart is the total amount of heap allocated during the benchmark. Numbers were extracted from GC logs.
The final chart represents the size of extracted information, as described above:
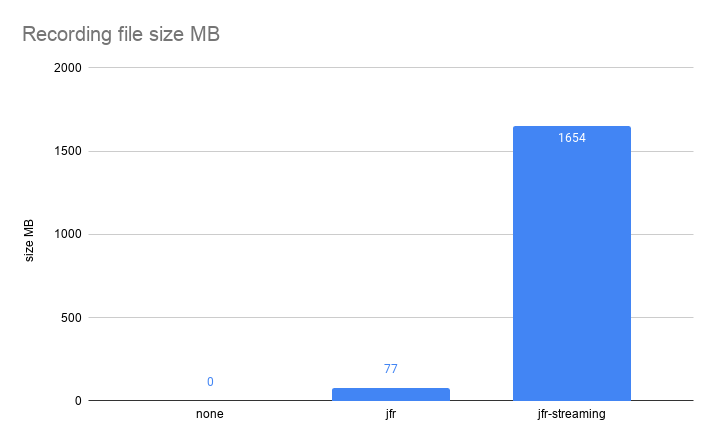
Note that the JFR file contains the full stacktraces, and that the jfr-streaming one is limited to the top 5 frames.
So what is the conclusion of these benchmarks? Not much, except for: “don’t use technology for things it was never intended for”. 😉
Summary
- JFR streaming is a great new way to expose JFR data for monitoring purposes.
- JFR streaming is available from JDK 14 and above.
- JFR streaming is complementary to the already existing JFR APIs, which remains the go-to way to use JFR for low-overhead detailed information (i.e. profiling / execution tracing).
- Knowing where and how to use JFR streaming is key to avoiding sad pandas.
[1]:https://www.reddit.com/r/java/comments/e97vos/jfr_event_streaming_with_jdk_14_in_outprocess/faiapm8/