Tunneling JMX in the 7u4 JDK

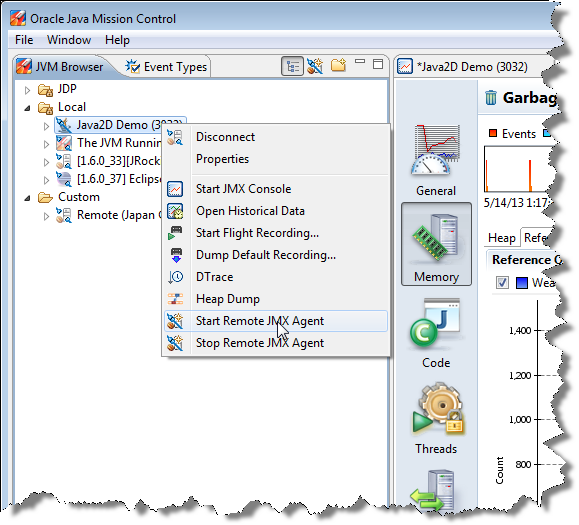
JMX is quite commonly used by various Java tools, such as Java Mission Control, JConsole and JVisualVM, to provide monitoring and management capabilities of the Java runtime and applications running in the JVM. The protocol most commonly used behind the scenes is JMX over RMI. It requires an RMI registry to be running, from which a stub for communicating with the RMI server can be looked up by the client. The RMI registry is running on well known port. For JRockit it was 7091 by default. For Hotspot it must be specified using a system property. The port for the RMI server, which is returned in the stub retrieved from the registry, is however anonymous by default. This makes tunneling traffic pretty cumbersome.

Now, one handy but often overlooked feature that entered the 7u4 JDK as part of the JRockit convergence, was the ability to specify the port of the RMI server. By setting the port used by the RMI registry and the RMI server to the same port, tunneling will be much easier. Now, the name of the property for setting the port of the RMI Server was slightly changed from the JRockit implementation, and is now called com.sun.management.jmxremote.rmi.port, instead of com.sun.management.rmiserver.port. Here is an example of how to enable the external management agent with the same RMI registry and RMI server port on the command line, in JDK 7u4 and later:

java -Dcom.sun.management.jmxremote.port=7091 -Dcom.sun.management.jmxremote.rmi.port=7091 -Dcom.sun.management.jmxremote.authenticate=false -Dcom.sun.management.jmxremote.ssl=false

One could argue that better names for the properties would have been rmi.server.port and rmi.registry.port. Ler

With some luck we will get startup flags similar to JRockit’s into Hotspot in the future. It is all too easy to get one of the system properties wrong, and there is no way you can tell for sure. The parameters are not validated. In JRockit the same command line as above would have been:

java –Xmanagement:port=7091,rmiserver.port=7091,ssl=false,authenticate=false

IMHO it makes much more sense to let the directive to tell the JVM to start a management agent be a startup flag, rather than a set of arbitrary system properties. Not to mention getting some of that sweet validation of the parameters. Blinkar

Mission Control Troubleshooting Tip – Logging

So, you’re having a bad day. Mission Control isn’t behaving the way it is supposed to, and you would really like it to be a bit more verbose about what it is doing. These are things you can try to make Mission Control a bit more talkative:

  1. Start Mission Control in debug mode, by adding the –debug flag. This will change the default java.util logging settings to also output FINE information. A note of caution – this may make various subsystems, such as chart rendering, to output debugging information in the GUI too.
  2. If FINE is not enough, you  can specify your own logging properties file in the preferences, directly under the Mission Control preference node. You can use the logging_debug.properties file in the com.jrockit.mc.rcp.application plugin as a starting point.
  3. Enable logging of Eclipse RCP related issues to the console, by specifying the –consoleLog flag.
  4. On windows, the jrmc launcher is derived from the javaw launcher – you will need to redirect stderr like this: 2>&1.

For example:

jmc –consoleLog –debug 2>&1 | more

Using the (Very Unsupported) Java Flight Recorder API

Since version 7u4 of the Hotspot JDK, there is a Java API for adding flight recording events to the Java Flight Recorder (JFR). Using this API to add your own event producers is quite unsupported, but very useful. It can, for instance, be used to add application specific events, such as a transaction event, to provide a context for all the other events being recorded by the flight recorder.

Now, in the interest of full disclosure, the API entered the Hotspot code base as @deprecated, since:

  1. It is in the com.oracle.jrockit namespace.
  2. The API will eventually be superceded by an improved “2.0” version.

So, the API is deprecated and unsupported. It is subject to change without notice. Don’t come complaining if it changes radically between releases! That being said, since the API is in use by WLS and others, it will likely remain available in its current form for the foreseeable future.

This article will show how user defined events can be put into the Flight Recorder. More specifically, how to:

  1. Add a new event producer,
  2. add a new event type, and,
  3. record events of the newly created event type.

In later articles I will show different ways to dump data from the flight recorder, different ways to get programmatic access to the events, as well as how to use the Mission Control client to analyse your events and how to build custom user interfaces in Mission Control for them.

Step 1 – Adding a Producer

To record events you need to add metadata about your event producer. As with all metadata, it is important to spend some time to ensure that the metadata is correct and useful. In my example we will create an event to track the trading of Smurfberries among the Smurfs on the fictional Smurfberry Exchange market. (Yes, I do know that Smurfs are fictional too, but please don’t tell my daughter.)

Here is a picture of papa smurf carrying smurfberries, for reference:
smx64

To create your producer you need to do something along the following:

private static final String PRODUCER_URI = "http://www.smx.com/smx/";
private static final Producer PRODUCER;
 
static {
    PRODUCER = createProducer();
}
 
private static Producer createProducer() {
    try {
        return new Producer("Smurfberry Exchange producer",
                "A demo event producer for the fictional Smurfberry Exchange.", PRODUCER_URI);
    } catch (Exception e) {
        // Add proper exception handling.
        e.printStackTrace();
    }
    return null;
}

Step 2 – Adding Event Type(s)

Next we declare the event types to be produced by our producer. In our case we want an event to be generated for each Smurfberry transaction.
We need to:

  1. Create our new event class.
  2. Register our new event type with the producer.

There are several different types of events that we can create.

  • Duration events
    These are events that last over a period of time, or, in other words, events that have a start and end time. The Garbage Collection event is an example of a duration event.
  • Timed events
    These are events for which a threshold can be configured in the recording engine. If the event duration is less than the threshold, the event will not be recorded. Java Sleep and Java Wait events are examples of timed events.
  • Instant events
    These events only have the time when the event took place. The Exception and Event Settings Changed are examples of instant events.
  • Requestable events
    These events can be configured to be polled periodically by the recording engine. The event implements a callback. An example of a requestable event is the CPU Load Sample event.

Conceptually Duration and Timed events are very similar, and from now on I will interchangebly refer to them collectively as duration events. Duration events are among the most useful ones, since they allow us to time things going on in our application. Since we want to time the transactions, we will use a duration event in the example. And since we want the end user creating a recording of our system to be able to decide how slow transactions to record, we will be using a TimedEvent.

Creating the event is easily done by subclassing the TimedEvent class, and annotating the class with the metadata for the event:

import com.oracle.jrockit.jfr.ContentType;
import com.oracle.jrockit.jfr.EventDefinition;
import com.oracle.jrockit.jfr.EventToken;
import com.oracle.jrockit.jfr.TimedEvent;
import com.oracle.jrockit.jfr.ValueDefinition;
 
@EventDefinition(path="smx/transaction", name = "SMX Transaction", description="An Smurfberry Exchange transaction.", stacktrace=true, thread=true)
public class TransactionEvent extends TimedEvent {
    @ValueDefinition(name="Price", description="The price at which the transaction was made.", contentType=ContentType.None)
    private float price;
 
    @ValueDefinition(name="Quantity", description="The quantity of smurfberries transferred.", contentType=ContentType.None)
    private int quantity;
 
    public TransactionEvent(EventToken eventToken) {
        super(eventToken);
    }
 
    public float getPrice() {
        return price;
    }
     
    public void setPrice(float price) {
        this.price = price;
    }
 
    public int getQuantity() {
        return quantity;
    }
 
    public void setQuantity(int quantity) {
        this.quantity = quantity;
    }
}

A few notes on the code above:

  • The path is where the event will be “mounted” in the overall EventType tree. Choose carefully.
  • The metadata will be used by all users to understand your event. Take care to explain your event properly.
  • The metadata about stacktrace and thread lets flightrecorder know that we want to capture the stacktrace from where the event is originating and thread information.
  • In this case, no appropriate content types are available, but if you are exposing things like time in nanos, bytes, Class names or similar, use the correct content type, and you will get a lot for free in the user interfaces for analysing your events.
  • If you have a field that will be shared among several events, and where the value can be used to join events from the different types, the field should also have a relational key. A relation key is a unique URI signifying a relationship between different events based on the values of specific fields, and work much like keys in a relational database. While these relations have no significance in the running application, they tell a renderer of flight recorder data that certain events should be associated and grouped together, typically to form an event chain. Here is an example:
    @ValueDefinition(name="transactionId", description="The transaction id for a fictive transaction.",
    	contentType=ContentType.None, relationKey="http://example.com/myserver/transactionId")
    private String transactionId;

Next we need to register the event type, and our producer, propely. Here is the extended code from Example Snippet 1:

private final static String PRODUCER_URI = "http://www.smx.com/smx/";
    private static final Producer PRODUCER;
    private static final EventToken TRANSACTION_EVENT_TOKEN;
     
    static {
        PRODUCER = createProducer();
        TRANSACTION_EVENT_TOKEN = createToken();
        PRODUCER.register();
    }
 
    /**
     * Creates our producer.
     */
    private static Producer createProducer() {
        try {
            return new Producer("Smurfberry Exchange producer",
                    "A demo event producer for the fictional Smurfberry Exchange.", PRODUCER_URI);
        } catch (Exception e) {
            // Add proper exception handling.
            e.printStackTrace();
        }
        return null;
    }
 
    /**
     * Creates our event token.
     */
    private static EventToken createToken() {
        try {
            return PRODUCER.addEvent(TransactionEvent.class);
        } catch (Exception e) {
            // Add proper exception handling.
            e.printStackTrace();
        }
        return null;
    }

Step 3 – Recording Events

Now we can start recording the smurfy transactions! It is quite simple – for a duration event, create the event, set the properties, end the event and then commit it to the flight recorder:

public void doTransaction(...) {
        TransactionEvent event = new TransactionEvent(SmurfBerryExchange.TRANSACTION_EVENT_TOKEN);
        event.begin();
        doWork();
        float price = getPrice();
        int quantity = getQuantity();
        event.setPrice(price);
        event.setQuantity(quantity);
        event.end();
        event.commit();
    }

That’s all there is to it. If you know you’re thread safe, you can dispens with the event object creation and simply reuse the event like this:

private TransactionEvent event = new TransactionEvent(SmurfBerryExchange.TRANSACTION_EVENT_TOKEN);
    public void doTransaction(...) {
        event.reset();
        event.begin();
        doWork();
        float price = getPrice();
        int quantity = getQuantity();
        event.setPrice(price);
        event.setQuantity(quantity);
        event.end();
        event.commit();
    }

Troubleshooting

If you can’t get it to work, you may want to check the following:

  1. In JRockit the flight recorder was always enabled. Not so in Hotspot. Don’t forget to enable the flight recorder: -XX:+UnlockCommercialFeatures -XX:+FlightRecorder
  2. You need a 7u4 or later to use this with a Hotspot JDK.
  3. Did you forget to keep a reference to the Producer?
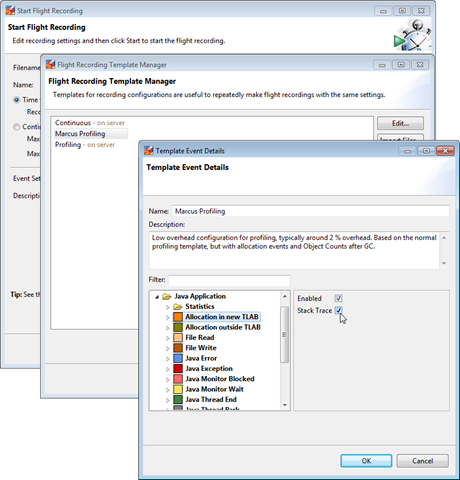
  4. Once you start recording your new events, you need to enable them. Easiest way is to setup a template in Mission Control (5.0 and later) and use that template for your recordings. If you are using pre-7u12 JVMs the server and client side templates are different, and you will need another type of template for jcmd to work. In 7u12 (JMC 5.2) and later they are the same.

For more information on using the Flight Recorder, see the following book.

Using the Mission Control DTrace Plug-in

There is a downloadable plug-in for Mission Control which adds DTrace support to Mission Control. It can be used to record running Java processes with highly detailed information from the underlying platform. It can also be highly customized and configured to record your own probes. It does so with a twist; for the recorded data to be the most useful, it needs to be in a self describing format that can easily be consumed by a client. Therefore Mission Control adds a few capabilities to DScript and, if installed into Eclipse from the eclipse update site, adds editing functionality of dscript files with the new syntax.

Together with the capability to quickly build your own user interface for the new probes, from within Mission Control itself, the DTrace plug-in provides quite powerful functionality for the platforms where DTrace exist.

Quick Overview

The DTrace plug-in lets you go from editing your self describing DTrace events…

…via DTrace execution on the server… …to the DTrace data visualized in Mission Control!
de_editor_small2 d_script_small2 cpu_tab_small2

Installing Mission Control & the DTrace Plug-in

If you are an Oracle employee, you should be using the latest builds of Java Mission Control 5.2. Contact me if you need information on how to get builds. If you are not, there is an early version of the DTrace plug-in available in JRockit Mission Control 4.1.

No matter which version you use, you have the choice to either use the stand alone version of Mission Control, or the Eclipse version. For DTrace they both have their own distinct advantages: the stand alone version provides easy access to the built in GUI editor, and the Eclipse version has nice editor support for the special DScript Event syntax.

For the stand alone version:

  1. Download JRockit: http://www.oracle.com/technetwork/middleware/jrockit/downloads/index.html
    Note that the client were not built for Solaris in the good old JRockit days, so be prepared to install the client on one of the other platforms. You can also try installing the plug-ins into an Eclipse. If you are an Oracle Employee, and you’re using Java Mission Control 5.2, there are builds for most platforms.
  2. Install the DTrace plug-in by selecting Help->Install Plug-ins, and then selecting the plugins under DTrace Recorder.

For the Eclipse version:

  1. Install Mission Control from the following update site: http://download.oracle.com/technology/products/missioncontrol/updatesites/base/4.1.0/eclipse/
  2. Install the DTrace Recorder plug-ins from the following update site: http://download.oracle.com/technology/products/missioncontrol/updatesites/experimental/4.1.0/eclipse/

Using the Plug-in As Is

After installing Mission Control and the DTrace plug-in, open the Help in Mission Control, or in Eclipse. Navigate to the Using the DTrace Recorder chapter. It will tell you all that is needed for basic use of the DTrace Recorder plug-in. Really, the documentation is quite good, and I would recommend taking a break here and go read it before proceeding. Ler

Adding Your Own Probes

This is most easily done if you have installed Mission Control and the DTrace plug-in into Eclipse. After installing and running a DTrace recording, a sample .de script file will be available to you, as explained in the documentation. A .de file is a dscript file embellished with our own syntax for creating self describing events. A .de file, together with the user input provided in the recording wizard, will be compiled into an ordinary dscript file.

The anatomy of the new .de script files are:

  • The Parameters
  • The Templates
  • Event Declarations
  • Probes

Parameters

The parameters are user defined parameters that will be presented to the user when a recording is started. Some are treated special by Mission Control and will be filled out by the framework. In the parameters section the meta data for the parameters are specified. Check out how the objectAllocationCutoff parameter is used in the Template for actual parameter use. Here is an example of a parameter metadata declaration:

@name = "Allocation Block Size" 
@type = "memory"
parameter objectAllocationCutoff;

The name annotation is the user friendly name that will be presented to a user of the parameter in the recording wizard. The type decides how input and rendering will be handled. The parameter keyword declares the parameter.

Templates

The template section declares the different templates the user can choose from. It declares which parameters will be available, and which probesets the user will be able to turn on and off. The following snippets show the standard profiling template provided with the plug-in:

@name ="Hotspot Profiling JDK6/JDK7";
template hotspotProfiling
{
    parameter processIdentifier (application = "java*");
    parameter objectAllocationCutoff(min = 1, value = 4096, max = 200000000);
 
    probeset Allocation (enabled = true);
    probeset ClassLoading (enabled = true);
    probeset GC (enabled = true);
    probeset IO (enabled = true);
    probeset JVMLocks (enabled = true);
    probeset JVMCompilation (enabled = true);
    probeset JVMOperations (enabled = true);
    probeset JavaLocks (enabled = true);
    probeset Paging (enabled = true);
    probeset Scheduling (enabled = true);
    probeset SystemCalls (enabled = true);
};

The template shows that the user will be able to choose processes with java in its application name. It also defines the range for the object allocation cutoff and a set of probesets that the user can select from, all of which be enabled by default.

A probe set is just what it sounds like – a set of probes that will be handled by the template as a group. A probeset is simply a listing of all the probes it includes:

@name ="Scheduling";
@description = "Records thread related information.";
probeset Scheduling
{
    probe cpu_on;
    probe cpu_off;
    probe cpu_exit;
    probe changed_priority;
    probe thread_start;
    probe thread_stop;
    probe thread_park_begin;
    probe thread_park_end;
    probe thread_unpark;
    probe thread_sleep_begin;
    probe thread_sleep_end;
    probe thread_yield;
    probe thread_migration;
};

Event Declarations

To be able to make sense of the events we emit, we need to set up some metadata to associate with them. The metadata includes the path to the event type, the user friendly name, the preferred color to render the events in, and the data fields used. This is an example on how to declare an event:

@name = "Running Thread";
@color = rgb(50, 255, 50);
@path = "Operating_System/Thread/Running";
event ThreadRunning
{
    @name ="Thread Name";
    string threadName;
 
    @name = "Thread";
    @description = "The thread the event occured in.";
    @type = "thread";
    int thread;
};

Note that, to help Mission Control make the most out of your data, it is quite useful to specify the content type with the @type annotation. There are often a lot of metadata that can be shared between different events. To help with that, there is a mixin keyword to specify metadata that can be shared. You can then use the extends keywork to import that data into your declaration, like this:

mixin Threadable
{
    @name = "Thread";
    @description = "The thread the event occured in.";
    @type = "thread";
    int thread;
};
...
@name = "Java Blocked";
@description = "Blocked on a Java monitor";
@color = rgb(255, 109, 100);
@path = "Java_Application/Monitor_Blocked";
event JavaMonitorBlocked extends Threadable, ClassLockable
{
};

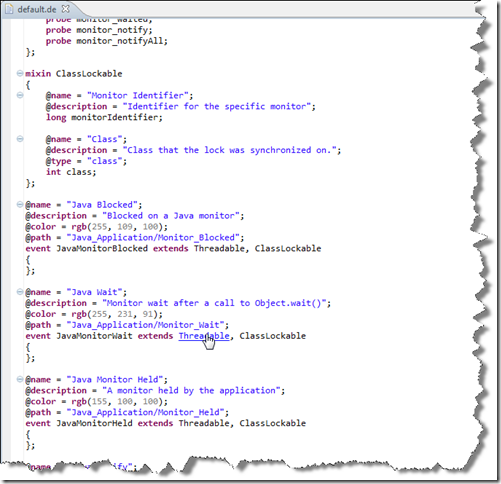
Note, that when editing these files in Eclipse, you have editor support with full syntax highlighting. You can also use ctrl (command on Mac) clicks to jump around in the source, like this:

jump

Probes

The final section is the probes. These are quite like dscript probes, with the important difference that the emit keyword is used for emitting data. Here is an example:

probe read_io
syscall::*read:entry
/ pid == $processIdentifier /
{
    emit IORead(thread = tid, size = arg2);
}

It is also possible to pair events together to form duration events, using the begin and end keywords:

probe syscall_entry
syscall:::entry
/ pid == $processIdentifier /
{
    begin SystemCall(thread = tid, function = probefunc);
}
 
probe syscall
syscall:::
/ pid == $processIdentifier /
{
    end SystemCall(thread = tid, function = probefunc);
}

Note that the pairing is done by matching up the arguments.

Adding Your Own GUI

Mission Control has a built in GUI designer that allows you to redesign the GUI from within itself. Since the designer is somewhat tricky to use, it is not yet supported. However, if you can live with the quirks, it is quite useful. You can, for instance, easily build a custom user interface for your own events.

First you need to get into open the design view.

For JRockit Mission Control 4.1, this is most easily done from within the stand alone (RCP) version of the tool. This is how you enable it:

  1. Start JAVA_HOME/bin/jmc
  2. Press ctrl-1. The Commands view should open.
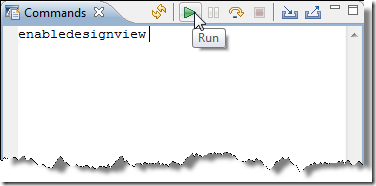
  3. In the Commands View, type enabledesignview, and press the play icon.

    commands
  4. The Designer View should open.

In late builds of Java Mission Control 5.2, this is simply done by selecting the Window->Show View->Designer menu. The designer view will control all the editing of your tabs, as well as control what tabgroups and tabs are available. It is also from the design view that you export your custom tabs as plug-ins. Now, the first quirk is:

You Must Prime Your Design View!

You prime it by loading a recording with the events that you want to build GUIs for. When you have loaded a recording, however, you cannot change the tabgroups or what tabs are available. So, if you want to add or remove tab groups or tabs, you normally directly close your newly opened recording. Yes. Quirk.

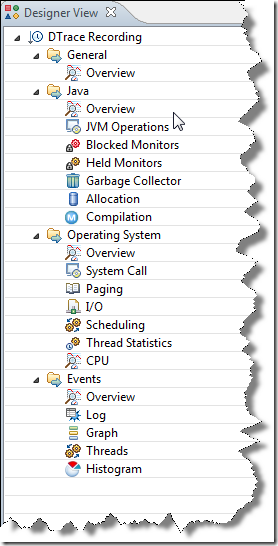
Designer view after opening recording:

designer1

Designer view after closing recording:

designer2

Now, to add a new tab group, you simply right click on the top node, and select New->New Group from the context menu. Add icons accordingly. If you want to change the relative position of your group, you can add a Placement Path. The Placement Path is a string that will be lexically compared with other strings to determine the position of the group. A placement path starting with ~ (tilde) is typically used to put a tab group towards the end.

To add a tab, simply right click on the tab group node, and select New->Tab.

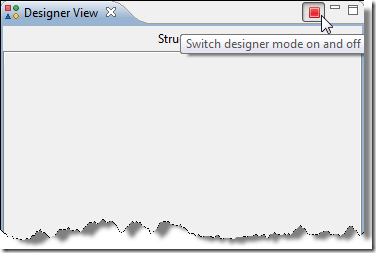
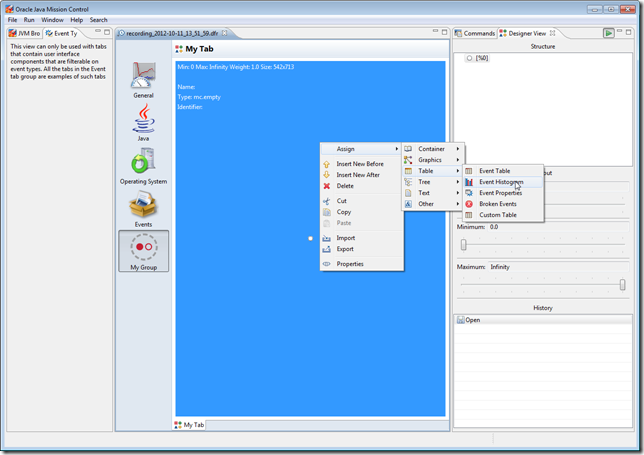
To edit your tab, load the recording containing the events for which you want to build a GUI, then press the stop button in the upper right corner of the Designer View. This will stop the GUI for that tab, and allow it to be edited. Assign components as required. For example, to add an event histogram:

  1. Right click on the empty area, and select Assign->Table->Event Histogram:addhistogram
  2. Fill out an identifier (anything that helps you remember the component later)
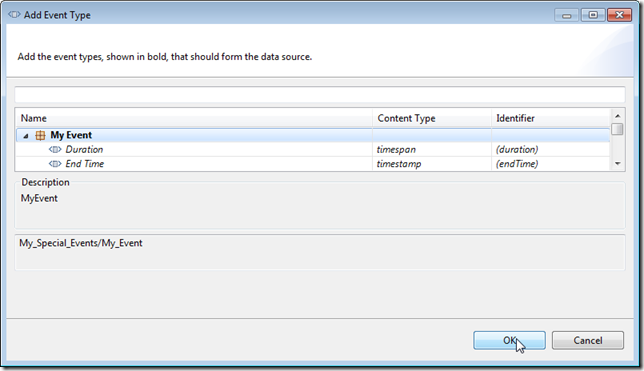
  3. Go to the Columns tab and press the Browse button, then browse button again, and select your event:browse_event
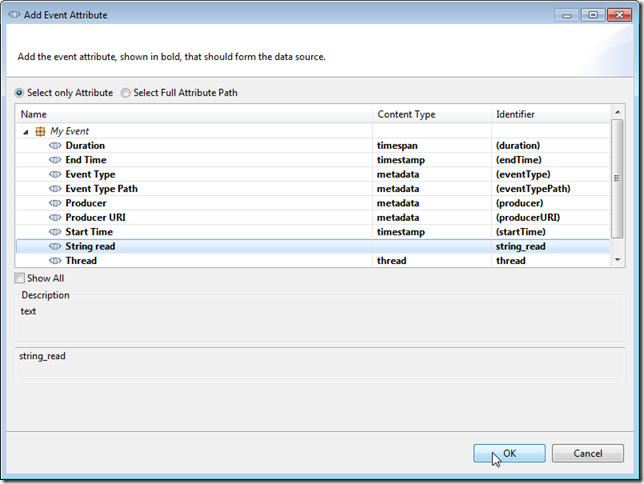
  4. Next click Group By and hit the Browse button. Select the attribute in your event that you want to group by:group_by
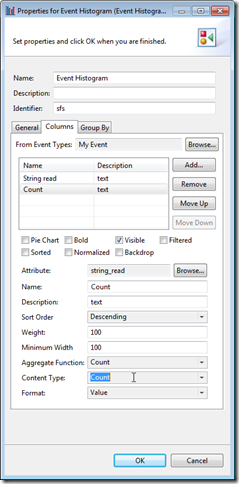
  5. Next add the columns you want in the table, by pressing add and selecting the attributes. For histograms, having the group by attribute first usually makes sense. You can easily make an event count field, by selecting any attribute, and then selecting Aggregation Function and Content Type to Count:

    count
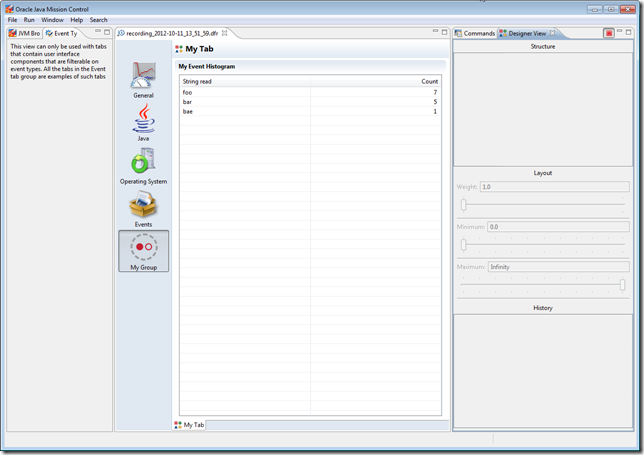
  6. Press play in the upper right corner to see your working user interface:

    donegui

Next you may want to store your new GUI as a plug-in, so that it can be shared with other users. This is easily done like this:

  1. Close your recording.
  2. Right click on the top node, and select Export UI to Plug-In.
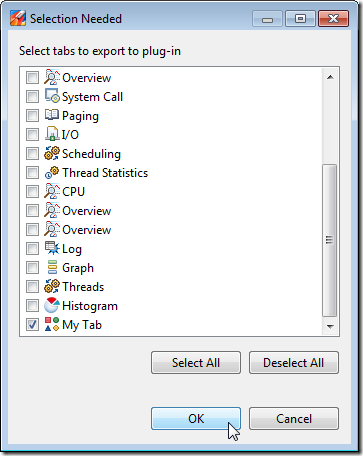
  3. Next select the tab to export. Note that you usually just want to export your own additions:select_tab_to_export
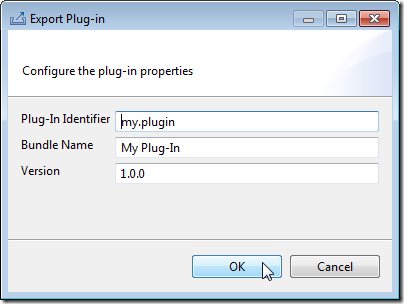
  4. Next select plug-in properties, such as the name and version. Note that higher versions of your plug-in will override older versions:

    plug-in-properties
  5. Finally select where it should be saved. Once exported, you can place the resulting jar file in the plug-in folder of another Mission Control to enjoy your user interface there.

That’s it! Have fun, and please let me know if you find this to be useful functionality that you would like the Mission Control team to continue to improve upon!

Big thanks to Klara Ward (@klaraward), the DTrace plug-in maintainer, for the help on this blog-post!

Finally Got Fiber Installed!

Yay! I finally got a fiber installed. This is really good news, since it means that my uplink is gazillion times faster than it was before, which in turn means it is possible to read my somewhat graphics intense blog without throwing a rage fit. Yay again!

Here is a picture of the speeds I measured yesterday:
image

Notice how you can actually look at this blog without patiently waiting for a few minutes! Blinkar

Speaking at JavaOne 2012–San Francisco

speaking_smallThis year I will only do one talk at Java One, and only  at the Java One in San Francisco (family is keeping me busy).

Here is some information about the session:

Wednesday, Oct 3
Time Room Title Abstract Type
13:00 -14:00 Hilton San Francisco – Plaza A/B Oracle JRockit Mission Control Is Dead: Long Live Java Mission Control!

Oracle Java Mission Control is the production time profiling and diagnostics tools suite originally created for the Oracle JRockit JVM. The convergence of Oracle’s HotSpot JVM and the Oracle JRockit JVM resulted in Oracle Java Mission Control’s support for HotSpot (only) from Release 5.0 and onward. This session is an introduction to what Oracle Java Mission Control is and how it can be used to profile Java applications in production systems with almost no overhead. The session also discusses how the HotSpot version of Oracle Java Mission Control differs from the JRockit version and shows some nice new experimental plug-ins available in the 5.0 release of Oracle Java Mission Control.

Conference Session Core Java Platform

Also, I think the following Mission Control session, with Misha Dmitriev and Johan Ringdahl, will be quite interesting:

Monday, Oct 1
Time Room Title Abstract Type
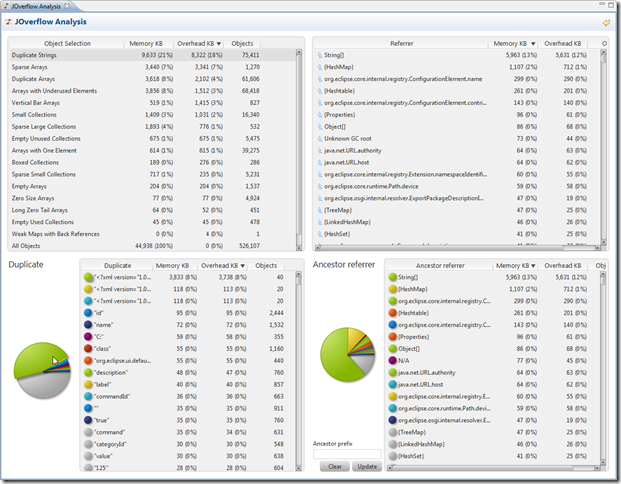
10:00 -11:00 Hilton San Francisco – Continental Ballroom 4 JOverflow: Advanced Heap Analysis in Java Mission Control

Large Java applications tend to be memory-hungry. Most profiling tools tell users which data structures consume memory but don’t tell whether that’s good or bad or how to improve the situation. JOverflow, a recent extension to Java Mission Control, analyzes a heap dump automatically, looking for known bad memory usage patterns. It detects empty and underused collections, duplicated strings, unused data fields, and several other issues. What’s more, for many of these problems, the tool can suggest a fix by analyzing application code together with the heap dump and thus save the developer hours of tedious and unrewarding work. Learn more in this session.

Conference Session Core Java Platform

Looking forward to seeing you there! Ler

j1_banner

Network Problems Using Java 7 and Cisco VPN?

Today I had a hard time getting my brand new Perforce plug-in working in my brand new Eclipse 4.2, from home over the Cisco VPN. After a while I realized that it was not only the Eclipse and Perforce plug-ins that had changed. I was also using a brand new JDK 7. I also realized that I had already encountered this problem before, when trying to use a brand new build of Java Mission Control 5 to hook up to a JVM at work:

  • The Cisco VPN seems to have some IPv6 related issue.
  • In JDK7 Java took the leap and started using IPv6 by default.
  • To revert to using IPv4 by default, set -Djava.net.preferIPv4Stack=true

For Eclipse, you can just add -Djava.net.preferIPv4Stack=true on a separate line in the eclipse.ini file, somewhere after –vmargs.

Lock Instance Visualization (JRMC 4.1.0)

For those of you who want pretty lock instance visualization, but do not want to build it yourselves, I have added a slightly more elaborate version as a downloadable plug-in here:
http://hirt.se/downloads/software/jfr/se.hirt.jfr.lockinstances_0.0.1.jar

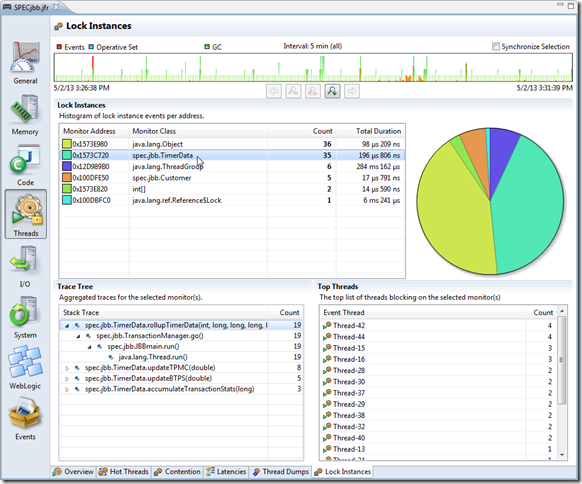
Simply download it and put it into your JROCKIT_HOME/missioncontrol/plugins folder. After restarting, you should have a tab that looks something like this:

lock_instances

The red bars in the range selector are, as usual, events visualized in the tab. The green bars in the range selector are GC events. As usual, if you do not like something about the GUI, feel free to use the design view to change it. The easiest way to get the design view to appear, is to press ctrl-1. This will bring up the Mission Control command console:

command

Enter enable then press ctrl-space to auto complete. Select enabledesignview from the list:

command2

Then press the ‘play’ button. A new view will appear:

command3

Close the Commands view and put the design view wherever you feel most comfortable having it. You can now, whenever you want to redesign a tab, pause that tab and enter the design mode by pressing the stop button in the design view:

edit

Why JCMD?

One of the reactions to my recent blog on JCMD has been “But, why?”. It is a reasonable question – after all, the simple examples I added to the blog can be solved using existing tools (jps, jstack etc) in the bin folder of any recent JDK. The answer is that JCMD provides:

  • A simple framework for easily adding more (self documenting) commands to the JVM.
  • One launcher to learn how to use.
  • The launcher is backwards and forward compatible. In other words, you can use an old version of the command to connect to a more recent version of the JVM, and vice versa.
  • There are already diagnostic commands available that are not covered by the old j* tools, such as the ability to control the JMX agent and the Flight Recorder. In the future more commands will be added.
  • In a future JDK update, a JMX interface will allow programmatic access to the diagnostic commands.

For a hint at what will be available in the future, check the JRCMD chapter in the JVM book.

Cool New Features in JDK7 update 4!

JDK7 was quite recently released, and I thought I should mention a few new cool things in it.

JCMD

First out is the port of the small JRockit command line utility JRCMD (JRockit Command). JRCMD was a command line tool to enumerate the Java processes running on the local machine, and to send commands (referred to as “Diagnostic Commands”) to them. JRCMD has been renamed JCMD (Java Command).

To list the locally running JVMs, simply run JAVA_HOME\bin\jcmd:

C:\Java\JDKs\JDK7_u4_official\bin>.\jcmd
4636 sun.tools.jconsole.JConsole
2620 HotspotKeepAlive
1076 sun.tools.jcmd.JCmd

You will see the JVMs running on the local machine listed by PID followed by main class. To see the commands available, run the help command, like this:

C:\Java\JDKs\JDK7_u4_official\bin>.\jcmd 4636 help
4636:
The following commands are available:
VM.commercial_features
ManagementAgent.stop
ManagementAgent.start_local
ManagementAgent.start
Thread.print
GC.class_histogram
GC.heap_dump
GC.run_finalization
GC.run
VM.uptime
VM.flags
VM.system_properties
VM.command_line
VM.version
help

For more information about a specific command use ‘help <command>’.

To get information about a specific command, use the help command followed by the command name:

C:\Java\JDKs\JDK7_u4_official\bin>.\jcmd 4636 help Thread.print
4636:
Thread.print
Print all threads with stacktraces.

Impact: Medium: Depends on the number of threads.

Syntax : Thread.print [options]

Options: (options must be specified using the <key> or <key>=<value> syntax)
        -l : [optional] print java.util.concurrent locks (BOOLEAN, false)

To get a thread stack dump with the concurrent locks:

C:\Java\JDKs\JDK7_u4_official\bin>.\jcmd 4636 Thread.print -l
4636:
2012-04-27 11:21:57
Full thread dump Java HotSpot(TM) Client VM (23.0-b21 mixed mode, sharing):

"DestroyJavaVM" prio=6 tid=0x003fb000 nid=0xc5c waiting on condition [0x00000000
]
   java.lang.Thread.State: RUNNABLE

   Locked ownable synchronizers:
        – None

"AWT-EventQueue-0" prio=6 tid=0x03e65800 nid=0x128c waiting on condition [0x041c
f000]
   java.lang.Thread.State: WAITING (parking)
        at sun.misc.Unsafe.park(Native Method)
        – parking to wait for  <0x2926dce8> (a java.util.concurrent.locks.Abstra
ctQueuedSynchronizer$ConditionObject)
        at java.util.concurrent.locks.LockSupport.park(LockSupport.java:186)
        at java.util.concurrent.locks.AbstractQueuedSynchronizer$ConditionObject
.await(AbstractQueuedSynchronizer.java:2043)
        at java.awt.EventQueue.getNextEvent(EventQueue.java:511)
        at java.awt.EventDispatchThread.pumpOneEventForFilters(EventDispatchThre
ad.java:213)
        at java.awt.EventDispatchThread.pumpEventsForFilter(EventDispatchThread.
java:163)
        at java.awt.EventDispatchThread.pumpEventsForHierarchy(EventDispatchThre
ad.java:151)
        at java.awt.EventDispatchThread.pumpEvents(EventDispatchThread.java:147)

        at java.awt.EventDispatchThread.pumpEvents(EventDispatchThread.java:139)

        at java.awt.EventDispatchThread.run(EventDispatchThread.java:97)

   Locked ownable synchronizers:
        – None

"Thread-2" prio=6 tid=0x03e61c00 nid=0xd4c in Object.wait() [0x042bf000]
   java.lang.Thread.State: TIMED_WAITING (on object monitor)
        at java.lang.Object.wait(Native Method)
        – waiting on <0x292432b0> (a java.io.PipedInputStream)
        at java.io.PipedInputStream.read(PipedInputStream.java:327)
        – locked <0x292432b0> (a java.io.PipedInputStream)
        at java.io.PipedInputStream.read(PipedInputStream.java:378)
        – locked <0x292432b0> (a java.io.PipedInputStream)
        at sun.nio.cs.StreamDecoder.readBytes(StreamDecoder.java:283)
        at sun.nio.cs.StreamDecoder.implRead(StreamDecoder.java:325)
        at sun.nio.cs.StreamDecoder.read(StreamDecoder.java:177)
        – locked <0x29249358> (a java.io.InputStreamReader)
        at java.io.InputStreamReader.read(InputStreamReader.java:184)
        at java.io.BufferedReader.fill(BufferedReader.java:154)
        at java.io.BufferedReader.readLine(BufferedReader.java:317)
        – locked <0x29249358> (a java.io.InputStreamReader)
        at java.io.BufferedReader.readLine(BufferedReader.java:382)
        at sun.tools.jconsole.OutputViewer$PipeListener.run(OutputViewer.java:10
9)

   Locked ownable synchronizers:
        – None

.

.

.
JNI global references: 528

Java Flight Recorder

The second big feature is the first port of the JRockit Flight Recorder – a high performance event recorder built into the JVM. Think of it as the data flight recorder (black box) of an aircraft. It records information about the JVM, its environment and the application running in the JVM, so that, if something happens, clues about what caused the problem can be found. Now, the first port of the flight recorder is quite limited in terms of the events actually being recorded. It is really released to be used with the event producer built into WebLogic Server through WLDF. Also, the Mission Control client is not yet released as part of the JDK (since it is not that useful without WLDF yet). If you’re an Oracle WebLogic customer, you can download the client on MOS.

That being said, to enable the functionality in 7u4, you need to add the following command line flags to your JVM startup command:

JAVA_HOME\bin\java -XX:+UnlockCommercialFeatures -XX:+FlightRecorder <your main class and params>

You can see that it has been enabled by using JCMD. A few flight recorder specific commands should now be available:

C:\Java\JDKs\JDK7_u4_official\bin>.\jcmd 2620 help
2620:
The following commands are available:
JFR.stop
JFR.start
JFR.dump
JFR.check
VM.commercial_features
ManagementAgent.stop
ManagementAgent.start_local
ManagementAgent.start
Thread.print
GC.class_histogram
GC.heap_dump
GC.run_finalization
GC.run
VM.uptime
VM.flags
VM.system_properties
VM.command_line
VM.version
help

For more information about a specific command use ‘help <command>’.

Unless you are a WLS user, I’d personally recommend waiting a release or two before starting using the Flight Recorder. There are not that many OS/JVM/JDK level events available yet, and there is a major performance improvement related to the time stamping of events just around the corner.