Creating Flight Recordings

With the Hotspot JDK 7u40 there is a nifty new tool called Java Mission Control. Users of the nifty old tool JRockit Mission Control will recognize a lot of the features. This particular blog entry focuses on the Java Flight Recorder and various ways you can go about to create a flight recording.

In the last blog entry about the method profiler I showed that Mission Control can be quite useful for profiling production systems. However, I only showed one way to produce the actual recording.

There are several different ways to produce a recording, all of them useful in a certain context. But before we get into that, we should first discuss the two different kinds of recordings.

Continuous Recordings

Continuous recordings are not only very hard to spell, they are also very common in production systems. Well, if Java Flight Recorder will be used anything like the JRockit equivalent, at least they will be. Continuous recordings have no end time and will keep recording until the JVM shuts down, or someone tells it to end. This kind of recording can be dumped at any point in time when access to the data being recorded is needed.

Time Fixed Recordings

Also known as profiling recordings, these recordings run for a fixed amount of time and then automatically end themselves. These typically use templates that enable costlier events, since the performance penalty will only be suffered for a limited duration of time.

Note that it is perfectly feasible to have several recordings running in parallel. It is even quite common. Which brings me to the first quirkiness of the Java Flight Recorder: Recordings active at the same time share the same buffers!

It may be easier to consider recordings to be named sets of Event Type settings, i.e. settings of what to record, that are being pushed and popped from the recording engine. At any given time, the union of the settings dictates what will be recorded.

Here is an example:
A continuous recording R0 is started at T0 with settings S0. After a while, a time fixed recording R1 is started at T1 with settings S1, where S1 ⊃ S0. The time fixed recording R1 ends at T2. This is what will be recorded:

Time Settings
T0→T1 S0
T1→T2 S0 ∪ S1
>T2 S0

Note that this means that if you dump the continuous recording R0 for a time range intersecting [T1,T2], you will actually find that you are getting information in your “recording” that you did not ask for in the settings (S0). All this in the name of performance. Blinkar Once T2 arrives, the settings for R1 will be popped, and we’re back to just recording S0.

Now, one last reminder before getting back to the actual recording:

The 1st Rule of Flight Recording*
Thou Shalt Never Forget to Start Your JVM with
-XX:+UnlockCommercialFeatures -XX:+FlightRecorder

RAmen!
(* Only required in HotSpot. With JRockit, no command line flags are required.)

Creating a Recording from Within Mission Control

This is probably the easiest way to produce a recording, since you get help both with connecting to the JVM from which you want the recording, and a nice wizard that helps you to select what to record. I went through the recording wizard in the blog entry about the method profiler, so I will not repeat that here. I will just note that the template settings that you arrive at can be exported from Mission Control, and then stored server side so that anyone connecting to that JVM though Mission Control will have access to it. Simply create a recording with the settings you would like to store, next go to the Template Manager, select the template marked as “ – last saved” and hit Export. Then put the exported file in the jre/lib/jfr folder of the JVM where you want to make the template available.

Creating a Recording Using Command Line Arguments

This is quite useful when you want to record the start up behaviour of an application, or when you want to make sure that your application always starts with a continuous recording running. Since I am a staunch believer of examples, I’ll simply give three examples.

Here is an example of how to start a one minute time fixed recording, 20 seconds after the JVM has started, using the profile template :
-XX:+UnlockCommercialFeatures -XX:+FlightRecorder -XX:StartFlightRecording=delay=20s,duration=60s,name=MyRecording,filename=C:\demo\myrecording.jfr,settings=profile

Note that the settings parameter either takes a path to a template, or the name of a template which must be available in the jre/lib/jfr folder of the JVM.

Here is an example on how to start a continuous recording, using the default template:
-XX:+UnlockCommercialFeatures -XX:+FlightRecorder -XX:StartFlightRecording=name=MyRecording,settings=default

Note that in the second example we do not specify any file name. The data will need to be dumped on request, either using Mission Control or jcmd, or possibly by using the dump-on-exit parameters to make the JVM dump the recording when exiting the JVM, like this:
-XX:+UnlockCommercialFeatures -XX:+FlightRecorder -XX:FlightRecorderOptions=defaultrecording=true,dumponexit=true,dumponexitpath=c:\demo\dumponexit.jfr

For more information on the available parameters, see the Java Command Line Reference.

Creating a Recording Using JCMD

You can also control the Flight Recorder even after you have started the java process (as long as you adhere to the 1st Rule of Flight Recording) using JCMD. The JCMD utility is in the JAVA_HOME/bin folder and allows you to enumerate the locally running Java processes, and send commands to them. Just running jcmd will list the running Java processes and their PIDs:

C:\Java\jmc5.2labs>jcmd
4711 LoadAndDeadlock
1276 sun.tools.jcmd.JCmd

To query a certain JVM for the available commands, use “help”:


C:\Java\jmc5.2labs>jcmd 7484 help
7484:
The following commands are available:
JFR.stop
JFR.start
JFR.dump
JFR.check
VM.native_memory
VM.commercial_features
ManagementAgent.stop
ManagementAgent.start_local
ManagementAgent.start
Thread.print
GC.class_histogram
GC.heap_dump
GC.run_finalization
GC.run
VM.uptime
VM.flags
VM.system_properties
VM.command_line
VM.version
help
For more information about a specific command use 'help <command>'.

Here is an example which starts a continuous recording from the command line using JCMD (assuming that the PID of the Java process you want to record on is 4711):

C:\Java\jmc5.2labs>jcmd 7484 JFR.start name=MyRecording settings=default
4711: Started recording 1. No limit (duration/maxsize/maxage) in use.

Use JFR.dump name=MyRecording filename=FILEPATH to copy recording data to file.

The JFR.check command can be used to check the status of the recordings:

C:\Java\jmc5.2labs>jcmd 4711 JFR.check
4711:
Recording: recording=1 name="MyRecording" (running)

To dump the recording:

C:\Java\jmc5.2labs>jcmd 4711 JFR.dump name=MyRecording filename=C:\demo\jcmddump .jfr
4711:
Dumped recording "MyRecording", 180.3 MB written to:

C:\demo\jcmddump.jfr

Then you can just drag and drop the resulting file into Mission Control to view the contents:

 pretty
(No blog post is complete without a Pretty Picture™.)

Further reading and useful links

Related Blogs:
Java Mission Control Finally Released
My JavaOne 2013 Sessions
Low Overhead Method Profiling with Mission Control

The Mission Control home page:
http://oracle.com/missioncontrol

Mission Control Base update site for Eclipse:
http://download.oracle.com/technology/products/missioncontrol/updatesites/base/5.2.0/eclipse/

Mission Control Experimental update site (Mission Control plug-ins):
http://download.oracle.com/technology/products/missioncontrol/updatesites/experimental/5.2.0/eclipse/

The Mission Control Facebook Community Page (not kidding):
http://www.facebook.com/pages/Java-Mission-Control/275169442493206

Mission Control on Twitter:
@javamissionctrl

Me on Twitter:
@hirt
Low Overhead Method Profiling with Java Mission Control

With the Hotspot JDK 7u40 there is a nifty new tool called Java Mission Control. Users of the nifty old tool JRockit Mission Control will recognize a lot of the features. This blog focuses on the Flight Recorder tool, and the method profiling information you can get from the flight recorder.

So you want to know why all your CPUs are saturated. Perhaps you even want to get some hints as to what changes can be done to your application to make it less CPU-hungry. Don’t despair – Java Mission Control to the rescue!

Built into the HotSpot JVM is something called the Java Flight Recorder. It records a lot of information about/from the JVM runtime, and can be thought of as similar to the Data Flight Recorders you find in modern airplanes. You normally use the Flight Recorder to find out what was happening in your JVM when something went wrong, but it is also a pretty awesome tool for production time profiling. Since Mission Control (using the default templates) normally don’t cause more than a per cent overhead, you can use it on your production server.

Getting the Data

So, to do method profiling with JMC, simply go about producing a recording like you normally would. Here is an example:

  1. Start the application you want to profile with the following arguments to enable the flight recorder:
     -XX:+UnlockCommercialFeatures -XX:+FlightRecorder 
  2. Next start Mission Control. You can just double click on jmc in the bin folder of your 7u40 JDK.
  3. (Close the Welcome screen if this is your first time starting JMC.)
  4. Right click on the JVM you wish to start a flight recording on in the JVM browser and select Start Flight Recording.
    StartFlightRecording
  5. Leave all the default settings and select the ‘Profiling – on server’ template for your Event Settings. You can usually just hit finish at this point, but I’d like to talk a bit on how you can control the method sampler.
  6. Click Next to go to the higher level event settings. These are groupings of named settings in the template. Here you can select how often you want JFR to sample methods by changing the Method Sampling setting.
    MethodSamplingSettings
  7. If this level of granularity is not enough, you can click next and modify the event settings on a per event type basis. Type Method in the filter text box.
    MethodSamplingAdvanced
    Note that you can go back and forth between the previous wizard page to find out what the high level settings really represent.
  8. When satisfied, click finished. The recording will be downloaded automatically and displayed in Mission Control. Click the tab group for Code to start visualizing your Method Profiling Sample events.
    SpecJBBMethodOverview
    (Since Java 2D hardly produces any load on my machine, I actually switched to a SpecJBB recording here. Blinkar )
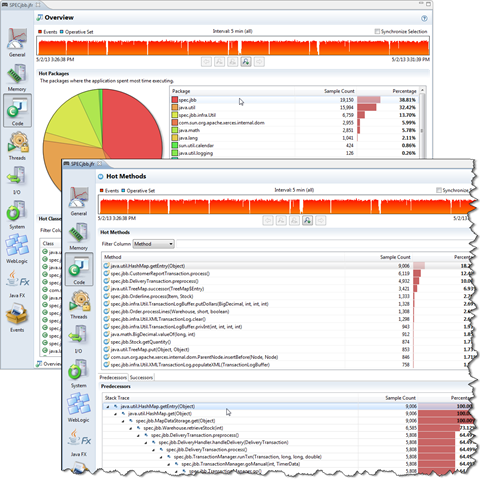
    On this tab you get a overview breakdown of where the JVM is spending the most time executing your application.
  9. Switch to the method profiling tab to find a top list of the hottest methods in your application.
    image
    The top ones are usually a good place to start optimizing.

Optimization

Once you’ve found your top methods, you either want to make sure that these methods are faster to execute, or that you call the method less. To find out how to call the method less, you normally look for ways to call along the predecessor stack traces less, and you look for the closest frame that you can change. It is quite common that the case is that some JDK core class and method is among the top methods.

Since you cannot rewrite, say, HashMap.getEntry(), you need to search along the path for something that you can change/control. In my recording, the next one is HashMap.get(), which does not help much. The next one after that might be a good candidate for optimization. An alternative would be to find somewhere along the entire path where we can reduce the number of times we need to call down to get whatever we need to get from the HashMap.

After you’ve done your optimizations you do a new recording to see if something else has popped up to the top. Notice that it really doesn’t matter exactly how much faster the method itself became. The only interesting characteristic is the relative time you spend executing that part of the Java code. It gives you a rough estimate of the maximum performance gain you can get from optimizing that method.

Command Line Flags

Aside from the normal command line flags to control the FlightRecorder (see this blog), there are some flags that are especially useful in the context of the method sampling events.

There is one flag you can use to control whether the method profiler should be available at all:

-XX:FlightRecorderOptions=samplethreads=[true|false]

There is also a flag to limit the stack depth for the stack traces. This is a performance optimization and a safety, so that the performance hit doesn’t run away, say if you have an insane stack depth and a lot of deep recursive calls. I believe it is set to 64 by default:

-XX:FlightRecorderOptions=stackdepth=<the wanted stack depth>

Limitations

The Flight Recorder method profiler is quite good at describing where the JVM is spending the the most time executing Java code at a very low overhead. There are, however, some limitations/caveats that can be useful to know about:

  1. If you have no CPU load, do not care too much about what the method profiling information tells you. You will get way fewer sample points, not to mention that the application may behave quite differently under load. Now, should your application be under heavy load and you still aren’t saturating the CPU, you should probably go check your latency events.
  2. The method profiler will not show you, or care about, time spent in native. If you happen to have a very low JVM generated CPU load and a high machine CPU load in your recording, you may be spending quite a lot of time in some native library.

Further reading and useful links

Related Blogs:
Java Mission Control Finally Released
My JavaOne 2013 Sessions

The Mission Control home page:
http://oracle.com/missioncontrol

Mission Control Base update site for Eclipse:
http://download.oracle.com/technology/products/missioncontrol/updatesites/base/5.2.0/eclipse/

Mission Control Experimental update site (Mission Control plug-ins):
http://download.oracle.com/technology/products/missioncontrol/updatesites/experimental/5.2.0/eclipse/

The Mission Control Facebook Community Page (not kidding):
http://www.facebook.com/pages/Java-Mission-Control/275169442493206

Mission Control on Twitter:
@javamissionctrl

Me on Twitter:
@hirt

My JavaOne 2013 Sessions

Now that Mission Control has finally been released, it will be way less frustrating to attend JavaOne! 🙂179481-j1-sf-imspeaking-125x125-1946241

Here are the sessions I am involved with this year:

Monday, 23rd
Time Room Title Abstract Type
11:30 – 12:30 Hilton San Francisco – Yosemite A Production-Time Profiling Out of the Box If you’ve installed the latest JDK 7 update, you’ve probably noticed that there is a new item on your start menu. This session discusses the latest addition to Oracle’s HotSpot JDK: Oracle Java Mission Control, a tool suite for low-overhead production-time profiling and diagnostics that originated with the JRockit JVM. As part of the convergence between the HotSpot and Oracle JRockit JVMs, Oracle Java Mission Control is now available in the HotSpot JDK. This session • Shows where we are in the JVM convergence effort • Explains what to expect from this first public version of Oracle Java Mission Control on HotSpot • Shows how to get started with Oracle Java Mission Control • Shows some experimental tooling available as plug-ins for Oracle Java Mission Control Conference Session (CON5113)
17:30 – 18:15 Hilton – Imperial Ballroom B Serviceability BOF This BOF session provides an opportunity to talk to HotSpot engineers about the various serviceability technologies available in Oracle’s HotSpot JDK. The technologies include Java Mission Control, JMX, Java Command (jcmd), attach, the Java Discovery Protocol (JDP), the Serviceability Agent, and more. If there are no questions, the engineers are very likely to start demonstrating favorite technologies and tips and tricks. BOF (BOF5376)
Tuesday, 24th
Time Room Title Abstract Type
10:00 – 12:00 Hilton – Continental Ballroom 1/2/3 Java Flight Recorder Deep Dive Detailed information about the new JDK7u40 feature of awesomeness. Tutorial (TUT5181)

Also, don’t miss Staffan Larsen’s talk on the JFR implementation in the HotSpot JVM –
Java Flight Recorder Behind the Scenes [CON5091]

Looking forward to seeing you at JavaOne! 🙂

Java Mission Control (Finally) Released!

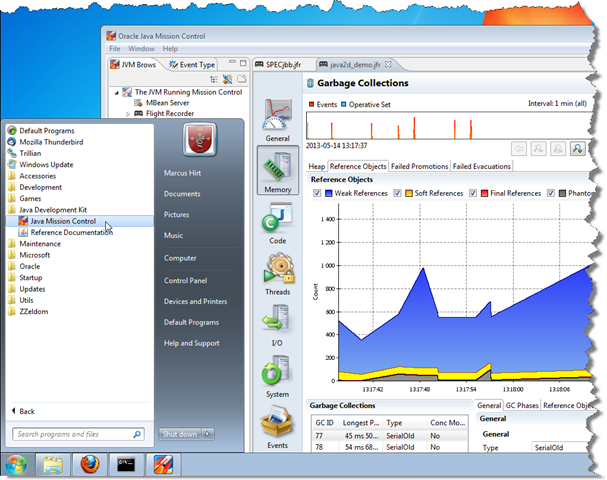
If you’ve had the time to download the latest Java 7 JDK update (7u40), you may have noticed that there is a new addition to the tools in the bin folder: Java Mission Control!

Java Mission Control is a production time tools suite that has its roots in the JRockit JVM tooling. This is the Mission Control team’s first public release in a couple of years, so we’re obviously quite excited! That said, the 5.2.0 version number is really a bit misleading – for most purposes and intent this is really a 1.0.0 release. Please have some patience as we bring Mission Control fully to par with what JRockit offered. Meanwhile I hope you find it as useful as I do!

I will be talking more about Java Mission Control in blogs later this week, but in this one I just thought I’d just do my own version of the release notes. Here goes:


General


Now part of the Hotspot JDK!
This is the first release of Java Mission Control that is bundled with the Hotspot JDK! The convergence project between JRockit and Hotspot has reached critical mass. With the 7u40 release of the Hotspot JDK the information available from HotSpot is equivalent to that of JRockit. This doesn’t necessarily mean that all events are exactly the same – the JRockit and HotSpot JVM implementations are quite different. It does mean, however, that the set of events available from HotSpot contains more than enough to be quite useful.

jdk

New JVM Browser
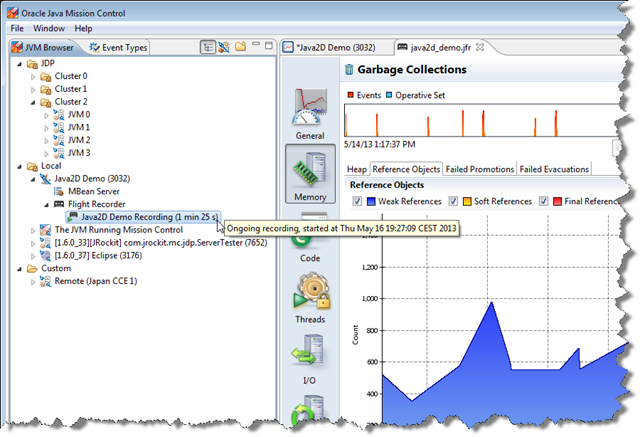
The JVM Browser now have sub-nodes for server side services available. The sub-nodes can show the state of the service. For instance, the Flight Recorder service will, if expanded, show what recordings are running on the server, if any. It also provides improved drag and drop behaviour, as the default action for each service will be invoked when the service is dragged to the editor area (or double clicked). The new JVM Browser can be viewed in two different modes – as a flat list, and as a tree. The flat list is useful when you are only working with local JVMs. The tree view makes it easier to keep track of JVMs discovered from multiple different sources, such as JDP-discovered JVMs, custom created remote connections, and local JVMs.

browser

Eclipse 3.8/4.2 support
Mission Control can now be installed in the Eclipse 3.8.2/4.2.2 IDE. There is also an update site for experimental plug-ins.

eclipse

Note: Unfortunately JMC 5.2.0 will not install in Eclipse 4.3.x or later (fixed in the upcoming 5.3.0 release of Mission Control). Also, note that the performance issues in the 4.x branch of Eclipse makes JMC quite a lot slower to work with in Eclipse 4.x compared to Eclipse 3.8. With some luck, this will improve in the upcoming 4.3.2 version of Eclipse. The stand alone version of JMC is built on 3.8.2 and is not affected.

Minor bug fixes and improvements
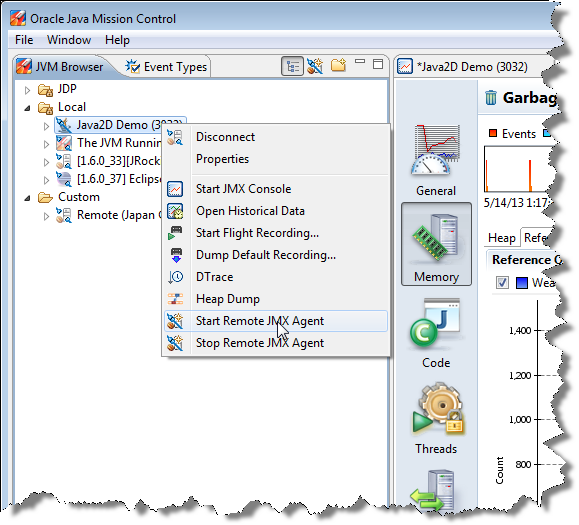
There are hundreds of minor fixes and improvements in this release. For example: Configurable encryption for the secure password store and support for the Hotspot version of JDP (Java Discovery Protocol, used to detect running JMX agents). There is also an action available now to start the external management agent on a locally running JVM.

startremote


Management Console


Improved MBean Browser
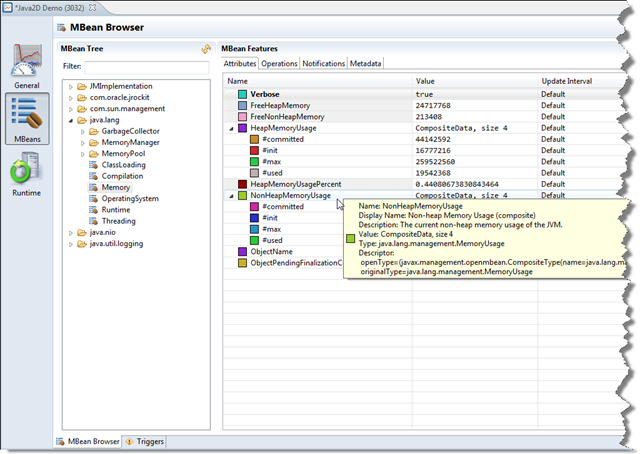
It is now possible to edit values for settable attributes directly in the attribute tree. Synthetic attributes (virtual attributes that are contributed through an extension point and calculated on the client side, possibly using server side values) now have a greyish background in the Name column. Column visibility can now be changed by right-clicking on a column header. The results of invoking multiple consecutive operations are now shown in the results section. Notifications in the notifications tab can now be arbitrarily expanded, just like attributes in the attributes tree. It is also possible to subscribe to multiple notifications at the same time.

browser

Coherence plug-in
The Coherence plug-in has seen numerous bug-fixes and resource optimizations. To install it into the stand alone version of Mission Control, go to Help | Install plug-ins… on the menu. To install it into Eclipse, first install the Eclipse plug-in version of Mission Control, then install it from the Experimental update-site.


Java Flight Recorder (JFR)


Event Convergence with JRockit
Hotspot has now reached event convergence with JRockit. That means that most useful information that was provided from JRockit is now also available from Hotspot. That said, JRockit and Hotspot are quite different JVMs; the information will in some cases be a bit different. That said, you can still profile most application with less than 2% overhead. Usually much less. Which, considering the information you get, is next to nothing.

jfr

Method profiling
There are now method profiling events! With the method profiling events you can find out where your application is spending the most time executing your Java code. This is, for instance, useful to optimize the application where the optimizations actually have an impact.

methodprofiling

Allocation profiling
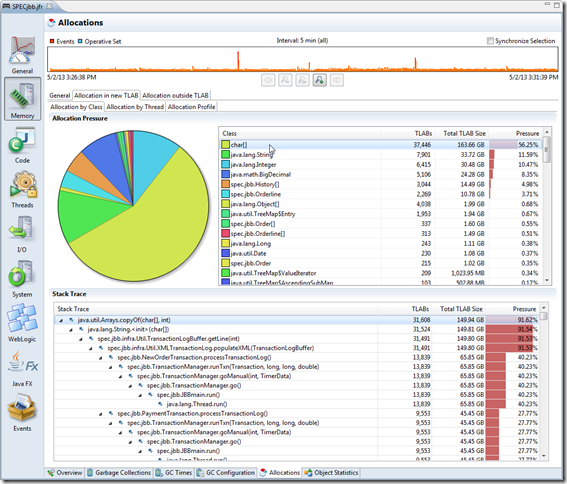
The allocation profiling tab has been improved. You can see per TLAB allocation with traces, and object being allocated directly in old space.

allocationprofiling

New and improved tabs
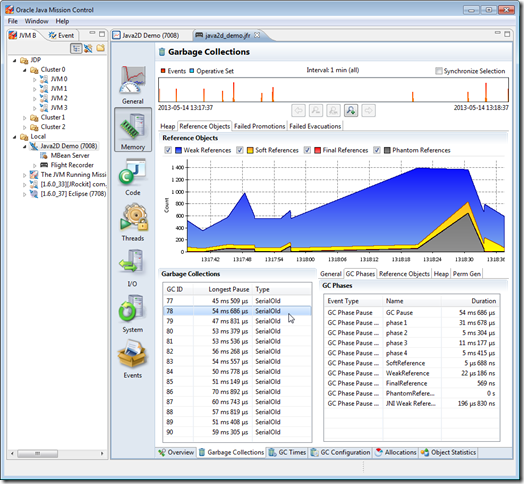
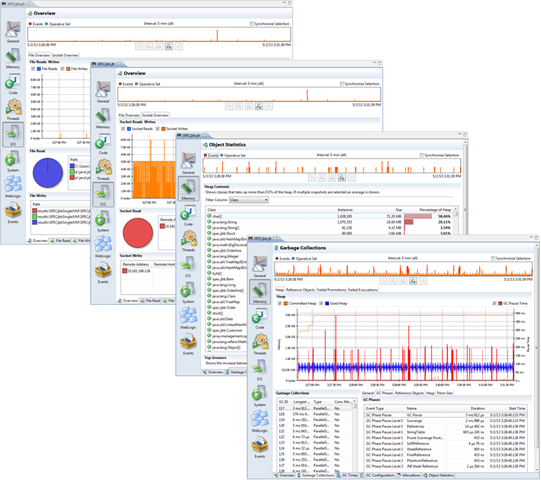
All tabs in the Flight Recorder have gotten a major overhaul. Some worth mentioning are, for example, the File I/O, Socket I/O, Compiler, Exception and GC tabs. Details and screenshots for all these changes would make for a very long New and Noteworthy – instead I encourage you to try them out!

newtabs

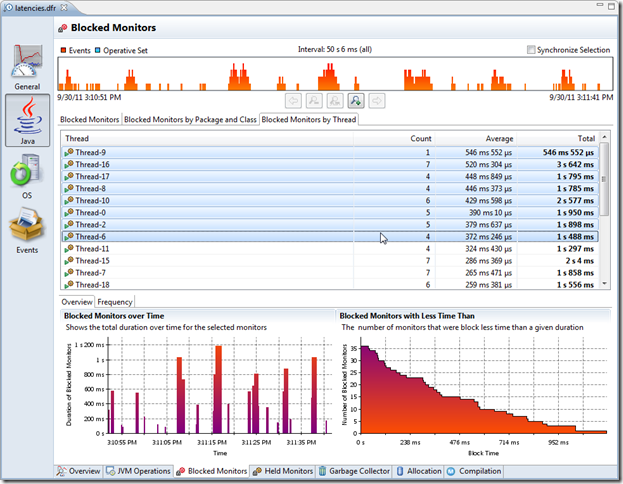
Latency analysis
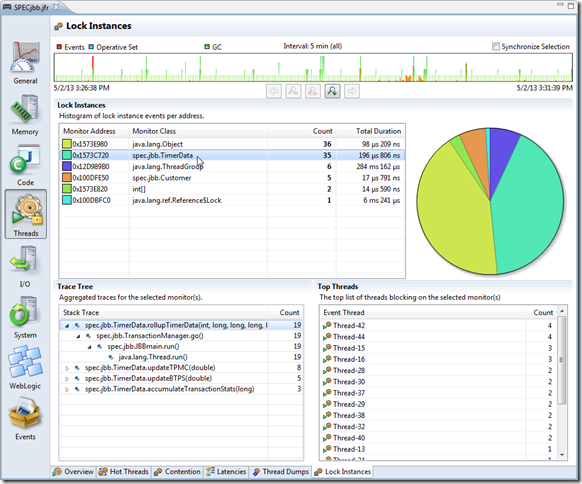
Sometimes you may wonder why the CPU never saturates, no matter how much load you generate for your app. Everything just starts going slower. The Flight Recorder records your thread stalls so that you can find out why. In this version you can look at individual monitor instances.

lockinstances

Thread graph
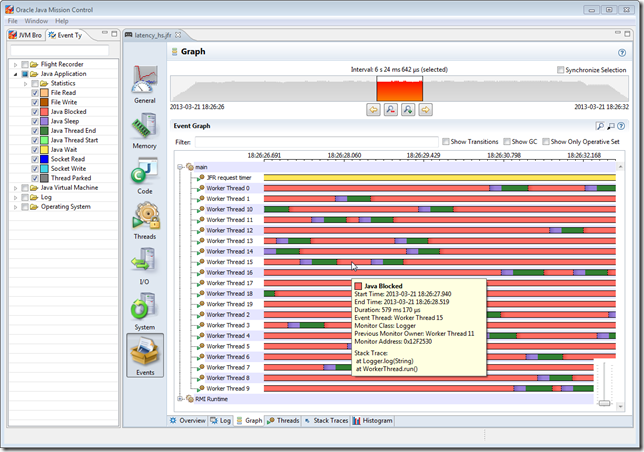
The thread graph is useful for getting an overview of what threads are running and what they are doing. Minor fixes in this version include better time stamps on the time line.

threadgraph

New Templates
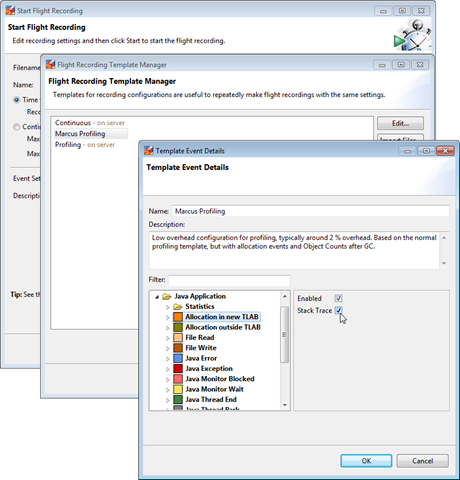
Previously you needed to know exactly what event types to configure when you wanted to change the recording settings. Now there is instead an easy to use configuration step in the templates where you will find the most useful settings. For instance, you can change how often method samples to record (Low, Medium, High), instead of needing to know exactly what event types to configure. You can still, of course, do the per Event Type fiddling if you would like to. Also, the client and server side template formats are the same, so you can export your templates from the client, and use them on the server.

newtemplates

Template Manager
There is also a new template manager to go with the new templates!

templatemanager


Experimental Plug-ins


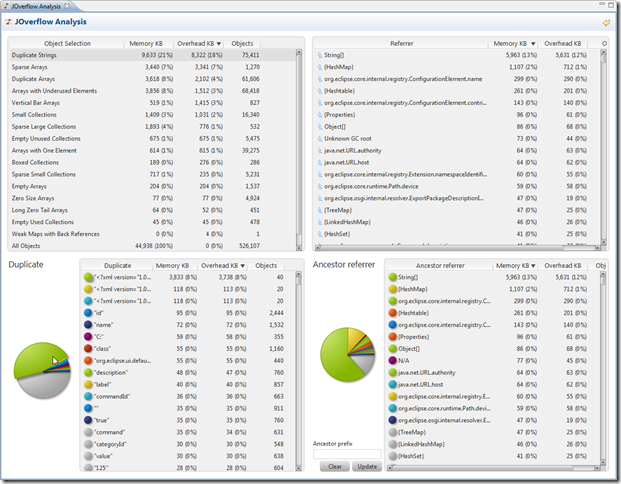
JOverflow – Heap dump analysis for memory waste
This plug-in allows Mission Control to do heap dump analysis, primarily to look for wasted heap space. There are several different anti-patterns JOverflow will look for, such as duplicate strings, underutilized collections etc. This plug-in also adds an action (for local connections) that will perform a heap dump and then visualize the heap dump with JOverflow.

joverflow

DTrace plug-in improvements
There has been a lot of bug fixes and improvements to the DTrace plug-in. The DTrace plug-in for Mission Control is available from the update site. To install it into the stand alone version of Mission Control, go to Help | Install New Software… on the menu. To install it into Eclipse, first install the Eclipse plug-in version of Mission Control, then install it from the Experimental update-site. The improvements to the plug-in include: improved error handling and error reporting, improved documentation, faster wizard start-up and miscellaneous bug-fixes. I’ve written a blog on the experimental D-Trace plug-in that contains some more information.

dtrace


Memleak


Not available (yet)!
If you are a JRockit Mission Control user, you will probably go look for the on-line heap analyser called Memleak. Well, the convergence between JRockit and Hotspot is not quite complete yet. We do however provide a useful heap dump analysis tool called JOverflow. More information above.

memleak


Further reading and useful links

The Mission Control home page: 
http://oracle.com/missioncontrol

Mission Control Base update site for Eclipse:
http://download.oracle.com/technology/products/missioncontrol/updatesites/base/5.2.0/eclipse/

Mission Control Experimental update site (Mission Control plug-ins):
http://download.oracle.com/technology/products/missioncontrol/updatesites/experimental/5.2.0/eclipse/

The Mission Control Facebook Community Page (not kidding):
http://www.facebook.com/pages/Java-Mission-Control/275169442493206

Mission Control on Twitter:
@javamissionctrl

Me on Twitter:
@hirt

Starting Flight Recordings from the Command Line

Sometimes you may want to start up a flight recording at JVM start up, or perhaps at a fixed time after JVM start. Perhaps you want a recording from how your application behaved whilst loading/setting up, or maybe you want to start the recording at exactly the same time after JVM start-up, so that it is easier to compare recordings from different runs. Another reason may be that application is so fantastically busy working, that it starves the poor threads involved in JMX communication, making connecting with tools a pain.
No matter what, here are examples on how to get your flight recordings done from the command line.

Using JVM startup-flags

Here is an example on how to start up a one minute recording 20 seconds after the start of the JVM:

-XX:+UnlockCommercialFeatures -XX:+FlightRecorder -XX:StartFlightRecording=delay=20s,duration=60s,name=MyRecording,filename=C:\TEMP\myrecording.jfr,settings=profile 

The settings parameter takes either the path to, or the name of, a template. The templates contain the settings, per event type, that the recording will use. The default ones that are shipped with the JDK are located in the jre/lib/jfr folder. Note that using the settings parameter will require either a JRockit or a Hotspot 7u40 or later.

Another good parameter to change, if you want more information on what is going on, is the log level:

-XX:FlightRecorderOptions=loglevel=info

For more information on the various parameters and options, see Oracle JRockit: The Definitive Guide. They are pretty much exactly the same for both Hotspot and JRockit.

Using jcmd

If you want to start a recording from the command line after the fact that you have started the JVM, that is possible too. JCMD, which I described in a previous blog, has a set of commands dedicated to controlling the Flight Recorder.

Here is how to kick off a recording using jcmd:

jcmd <pid> JFR.start delay=20s duration=60s name=MyRecording filename=C:\TEMP\mycraprecording.jfr settings=profile

Note that <pid> is the process identifier of the Java process you want to start recording. The easist way to find it is probably to run jcmd without parameters.

Tunneling JMX in the 7u4 JDK

JMX is quite commonly used by various Java tools, such as Java Mission Control, JConsole and JVisualVM, to provide monitoring and management capabilities of the Java runtime and applications running in the JVM. The protocol most commonly used behind the scenes is JMX over RMI. It requires an RMI registry to be running, from which a stub for communicating with the RMI server can be looked up by the client. The RMI registry is running on well known port. For JRockit it was 7091 by default. For Hotspot it must be specified using a system property. The port for the RMI server, which is returned in the stub retrieved from the registry, is however anonymous by default. This makes tunneling traffic pretty cumbersome.

Now, one handy but often overlooked feature that entered the 7u4 JDK as part of the JRockit convergence, was the ability to specify the port of the RMI server. By setting the port used by the RMI registry and the RMI server to the same port, tunneling will be much easier. Now, the name of the property for setting the port of the RMI Server was slightly changed from the JRockit implementation, and is now called com.sun.management.jmxremote.rmi.port, instead of com.sun.management.rmiserver.port. Here is an example of how to enable the external management agent with the same RMI registry and RMI server port on the command line, in JDK 7u4 and later:

java -Dcom.sun.management.jmxremote.port=7091 -Dcom.sun.management.jmxremote.rmi.port=7091 -Dcom.sun.management.jmxremote.authenticate=false -Dcom.sun.management.jmxremote.ssl=false

One could argue that better names for the properties would have been rmi.server.port and rmi.registry.port. Ler

With some luck we will get startup flags similar to JRockit’s into Hotspot in the future. It is all too easy to get one of the system properties wrong, and there is no way you can tell for sure. The parameters are not validated. In JRockit the same command line as above would have been:

java –Xmanagement:port=7091,rmiserver.port=7091,ssl=false,authenticate=false

IMHO it makes much more sense to let the directive to tell the JVM to start a management agent be a startup flag, rather than a set of arbitrary system properties. Not to mention getting some of that sweet validation of the parameters. Blinkar

Mission Control Troubleshooting Tip – Logging

So, you’re having a bad day. Mission Control isn’t behaving the way it is supposed to, and you would really like it to be a bit more verbose about what it is doing. These are things you can try to make Mission Control a bit more talkative:

  1. Start Mission Control in debug mode, by adding the –debug flag. This will change the default java.util logging settings to also output FINE information. A note of caution – this may make various subsystems, such as chart rendering, to output debugging information in the GUI too.
  2. If FINE is not enough, you  can specify your own logging properties file in the preferences, directly under the Mission Control preference node. You can use the logging_debug.properties file in the com.jrockit.mc.rcp.application plugin as a starting point.
  3. Enable logging of Eclipse RCP related issues to the console, by specifying the –consoleLog flag.
  4. On windows, the jrmc launcher is derived from the javaw launcher – you will need to redirect stderr like this: 2>&1.

For example:

jmc –consoleLog –debug 2>&1 | more

Using the (Very Unsupported) Java Flight Recorder API

Since version 7u4 of the Hotspot JDK, there is a Java API for adding flight recording events to the Java Flight Recorder (JFR). Using this API to add your own event producers is quite unsupported, but very useful. It can, for instance, be used to add application specific events, such as a transaction event, to provide a context for all the other events being recorded by the flight recorder.

Now, in the interest of full disclosure, the API entered the Hotspot code base as @deprecated, since:

  1. It is in the com.oracle.jrockit namespace.
  2. The API will eventually be superceded by an improved “2.0” version.

So, the API is deprecated and unsupported. It is subject to change without notice. Don’t come complaining if it changes radically between releases! That being said, since the API is in use by WLS and others, it will likely remain available in its current form for the foreseeable future.

This article will show how user defined events can be put into the Flight Recorder. More specifically, how to:

  1. Add a new event producer,
  2. add a new event type, and,
  3. record events of the newly created event type.

In later articles I will show different ways to dump data from the flight recorder, different ways to get programmatic access to the events, as well as how to use the Mission Control client to analyse your events and how to build custom user interfaces in Mission Control for them.

Step 1 – Adding a Producer

To record events you need to add metadata about your event producer. As with all metadata, it is important to spend some time to ensure that the metadata is correct and useful. In my example we will create an event to track the trading of Smurfberries among the Smurfs on the fictional Smurfberry Exchange market. (Yes, I do know that Smurfs are fictional too, but please don’t tell my daughter.)

Here is a picture of papa smurf carrying smurfberries, for reference:
smx64

To create your producer you need to do something along the following:

private static final String PRODUCER_URI = "http://www.smx.com/smx/";
private static final Producer PRODUCER;
 
static {
    PRODUCER = createProducer();
}
 
private static Producer createProducer() {
    try {
        return new Producer("Smurfberry Exchange producer",
                "A demo event producer for the fictional Smurfberry Exchange.", PRODUCER_URI);
    } catch (Exception e) {
        // Add proper exception handling.
        e.printStackTrace();
    }
    return null;
}

Step 2 – Adding Event Type(s)

Next we declare the event types to be produced by our producer. In our case we want an event to be generated for each Smurfberry transaction.
We need to:

  1. Create our new event class.
  2. Register our new event type with the producer.

There are several different types of events that we can create.

  • Duration events
    These are events that last over a period of time, or, in other words, events that have a start and end time. The Garbage Collection event is an example of a duration event.
  • Timed events
    These are events for which a threshold can be configured in the recording engine. If the event duration is less than the threshold, the event will not be recorded. Java Sleep and Java Wait events are examples of timed events.
  • Instant events
    These events only have the time when the event took place. The Exception and Event Settings Changed are examples of instant events.
  • Requestable events
    These events can be configured to be polled periodically by the recording engine. The event implements a callback. An example of a requestable event is the CPU Load Sample event.

Conceptually Duration and Timed events are very similar, and from now on I will interchangebly refer to them collectively as duration events. Duration events are among the most useful ones, since they allow us to time things going on in our application. Since we want to time the transactions, we will use a duration event in the example. And since we want the end user creating a recording of our system to be able to decide how slow transactions to record, we will be using a TimedEvent.

Creating the event is easily done by subclassing the TimedEvent class, and annotating the class with the metadata for the event:

import com.oracle.jrockit.jfr.ContentType;
import com.oracle.jrockit.jfr.EventDefinition;
import com.oracle.jrockit.jfr.EventToken;
import com.oracle.jrockit.jfr.TimedEvent;
import com.oracle.jrockit.jfr.ValueDefinition;
 
@EventDefinition(path="smx/transaction", name = "SMX Transaction", description="An Smurfberry Exchange transaction.", stacktrace=true, thread=true)
public class TransactionEvent extends TimedEvent {
    @ValueDefinition(name="Price", description="The price at which the transaction was made.", contentType=ContentType.None)
    private float price;
 
    @ValueDefinition(name="Quantity", description="The quantity of smurfberries transferred.", contentType=ContentType.None)
    private int quantity;
 
    public TransactionEvent(EventToken eventToken) {
        super(eventToken);
    }
 
    public float getPrice() {
        return price;
    }
     
    public void setPrice(float price) {
        this.price = price;
    }
 
    public int getQuantity() {
        return quantity;
    }
 
    public void setQuantity(int quantity) {
        this.quantity = quantity;
    }
}

A few notes on the code above:

  • The path is where the event will be “mounted” in the overall EventType tree. Choose carefully.
  • The metadata will be used by all users to understand your event. Take care to explain your event properly.
  • The metadata about stacktrace and thread lets flightrecorder know that we want to capture the stacktrace from where the event is originating and thread information.
  • In this case, no appropriate content types are available, but if you are exposing things like time in nanos, bytes, Class names or similar, use the correct content type, and you will get a lot for free in the user interfaces for analysing your events.
  • If you have a field that will be shared among several events, and where the value can be used to join events from the different types, the field should also have a relational key. A relation key is a unique URI signifying a relationship between different events based on the values of specific fields, and work much like keys in a relational database. While these relations have no significance in the running application, they tell a renderer of flight recorder data that certain events should be associated and grouped together, typically to form an event chain. Here is an example:
    @ValueDefinition(name="transactionId", description="The transaction id for a fictive transaction.",
    	contentType=ContentType.None, relationKey="http://example.com/myserver/transactionId")
    private String transactionId;

Next we need to register the event type, and our producer, propely. Here is the extended code from Example Snippet 1:

private final static String PRODUCER_URI = "http://www.smx.com/smx/";
    private static final Producer PRODUCER;
    private static final EventToken TRANSACTION_EVENT_TOKEN;
     
    static {
        PRODUCER = createProducer();
        TRANSACTION_EVENT_TOKEN = createToken();
        PRODUCER.register();
    }
 
    /**
     * Creates our producer.
     */
    private static Producer createProducer() {
        try {
            return new Producer("Smurfberry Exchange producer",
                    "A demo event producer for the fictional Smurfberry Exchange.", PRODUCER_URI);
        } catch (Exception e) {
            // Add proper exception handling.
            e.printStackTrace();
        }
        return null;
    }
 
    /**
     * Creates our event token.
     */
    private static EventToken createToken() {
        try {
            return PRODUCER.addEvent(TransactionEvent.class);
        } catch (Exception e) {
            // Add proper exception handling.
            e.printStackTrace();
        }
        return null;
    }

Step 3 – Recording Events

Now we can start recording the smurfy transactions! It is quite simple – for a duration event, create the event, set the properties, end the event and then commit it to the flight recorder:

public void doTransaction(...) {
        TransactionEvent event = new TransactionEvent(SmurfBerryExchange.TRANSACTION_EVENT_TOKEN);
        event.begin();
        doWork();
        float price = getPrice();
        int quantity = getQuantity();
        event.setPrice(price);
        event.setQuantity(quantity);
        event.end();
        event.commit();
    }

That’s all there is to it. If you know you’re thread safe, you can dispens with the event object creation and simply reuse the event like this:

private TransactionEvent event = new TransactionEvent(SmurfBerryExchange.TRANSACTION_EVENT_TOKEN);
    public void doTransaction(...) {
        event.reset();
        event.begin();
        doWork();
        float price = getPrice();
        int quantity = getQuantity();
        event.setPrice(price);
        event.setQuantity(quantity);
        event.end();
        event.commit();
    }

Troubleshooting

If you can’t get it to work, you may want to check the following:

  1. In JRockit the flight recorder was always enabled. Not so in Hotspot. Don’t forget to enable the flight recorder: -XX:+UnlockCommercialFeatures -XX:+FlightRecorder
  2. You need a 7u4 or later to use this with a Hotspot JDK.
  3. Did you forget to keep a reference to the Producer?
  4. Once you start recording your new events, you need to enable them. Easiest way is to setup a template in Mission Control (5.0 and later) and use that template for your recordings. If you are using pre-7u12 JVMs the server and client side templates are different, and you will need another type of template for jcmd to work. In 7u12 (JMC 5.2) and later they are the same.

For more information on using the Flight Recorder, see the following book.

Using the Mission Control DTrace Plug-in

There is a downloadable plug-in for Mission Control which adds DTrace support to Mission Control. It can be used to record running Java processes with highly detailed information from the underlying platform. It can also be highly customized and configured to record your own probes. It does so with a twist; for the recorded data to be the most useful, it needs to be in a self describing format that can easily be consumed by a client. Therefore Mission Control adds a few capabilities to DScript and, if installed into Eclipse from the eclipse update site, adds editing functionality of dscript files with the new syntax.

Together with the capability to quickly build your own user interface for the new probes, from within Mission Control itself, the DTrace plug-in provides quite powerful functionality for the platforms where DTrace exist.

Quick Overview

The DTrace plug-in lets you go from editing your self describing DTrace events…

…via DTrace execution on the server… …to the DTrace data visualized in Mission Control!
de_editor_small2 d_script_small2 cpu_tab_small2

Installing Mission Control & the DTrace Plug-in

If you are an Oracle employee, you should be using the latest builds of Java Mission Control 5.2. Contact me if you need information on how to get builds. If you are not, there is an early version of the DTrace plug-in available in JRockit Mission Control 4.1.

No matter which version you use, you have the choice to either use the stand alone version of Mission Control, or the Eclipse version. For DTrace they both have their own distinct advantages: the stand alone version provides easy access to the built in GUI editor, and the Eclipse version has nice editor support for the special DScript Event syntax.

For the stand alone version:

  1. Download JRockit: http://www.oracle.com/technetwork/middleware/jrockit/downloads/index.html
    Note that the client were not built for Solaris in the good old JRockit days, so be prepared to install the client on one of the other platforms. You can also try installing the plug-ins into an Eclipse. If you are an Oracle Employee, and you’re using Java Mission Control 5.2, there are builds for most platforms.
  2. Install the DTrace plug-in by selecting Help->Install Plug-ins, and then selecting the plugins under DTrace Recorder.

For the Eclipse version:

  1. Install Mission Control from the following update site: http://download.oracle.com/technology/products/missioncontrol/updatesites/base/4.1.0/eclipse/
  2. Install the DTrace Recorder plug-ins from the following update site: http://download.oracle.com/technology/products/missioncontrol/updatesites/experimental/4.1.0/eclipse/

Using the Plug-in As Is

After installing Mission Control and the DTrace plug-in, open the Help in Mission Control, or in Eclipse. Navigate to the Using the DTrace Recorder chapter. It will tell you all that is needed for basic use of the DTrace Recorder plug-in. Really, the documentation is quite good, and I would recommend taking a break here and go read it before proceeding. Ler

Adding Your Own Probes

This is most easily done if you have installed Mission Control and the DTrace plug-in into Eclipse. After installing and running a DTrace recording, a sample .de script file will be available to you, as explained in the documentation. A .de file is a dscript file embellished with our own syntax for creating self describing events. A .de file, together with the user input provided in the recording wizard, will be compiled into an ordinary dscript file.

The anatomy of the new .de script files are:

  • The Parameters
  • The Templates
  • Event Declarations
  • Probes

Parameters

The parameters are user defined parameters that will be presented to the user when a recording is started. Some are treated special by Mission Control and will be filled out by the framework. In the parameters section the meta data for the parameters are specified. Check out how the objectAllocationCutoff parameter is used in the Template for actual parameter use. Here is an example of a parameter metadata declaration:

@name = "Allocation Block Size" 
@type = "memory"
parameter objectAllocationCutoff;

The name annotation is the user friendly name that will be presented to a user of the parameter in the recording wizard. The type decides how input and rendering will be handled. The parameter keyword declares the parameter.

Templates

The template section declares the different templates the user can choose from. It declares which parameters will be available, and which probesets the user will be able to turn on and off. The following snippets show the standard profiling template provided with the plug-in:

@name ="Hotspot Profiling JDK6/JDK7";
template hotspotProfiling
{
    parameter processIdentifier (application = "java*");
    parameter objectAllocationCutoff(min = 1, value = 4096, max = 200000000);
 
    probeset Allocation (enabled = true);
    probeset ClassLoading (enabled = true);
    probeset GC (enabled = true);
    probeset IO (enabled = true);
    probeset JVMLocks (enabled = true);
    probeset JVMCompilation (enabled = true);
    probeset JVMOperations (enabled = true);
    probeset JavaLocks (enabled = true);
    probeset Paging (enabled = true);
    probeset Scheduling (enabled = true);
    probeset SystemCalls (enabled = true);
};

The template shows that the user will be able to choose processes with java in its application name. It also defines the range for the object allocation cutoff and a set of probesets that the user can select from, all of which be enabled by default.

A probe set is just what it sounds like – a set of probes that will be handled by the template as a group. A probeset is simply a listing of all the probes it includes:

@name ="Scheduling";
@description = "Records thread related information.";
probeset Scheduling
{
    probe cpu_on;
    probe cpu_off;
    probe cpu_exit;
    probe changed_priority;
    probe thread_start;
    probe thread_stop;
    probe thread_park_begin;
    probe thread_park_end;
    probe thread_unpark;
    probe thread_sleep_begin;
    probe thread_sleep_end;
    probe thread_yield;
    probe thread_migration;
};

Event Declarations

To be able to make sense of the events we emit, we need to set up some metadata to associate with them. The metadata includes the path to the event type, the user friendly name, the preferred color to render the events in, and the data fields used. This is an example on how to declare an event:

@name = "Running Thread";
@color = rgb(50, 255, 50);
@path = "Operating_System/Thread/Running";
event ThreadRunning
{
    @name ="Thread Name";
    string threadName;
 
    @name = "Thread";
    @description = "The thread the event occured in.";
    @type = "thread";
    int thread;
};

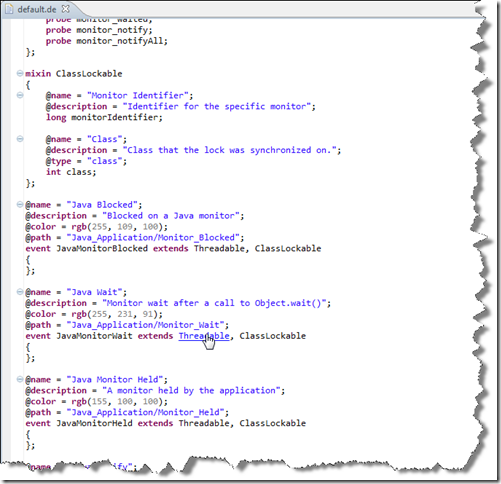
Note that, to help Mission Control make the most out of your data, it is quite useful to specify the content type with the @type annotation. There are often a lot of metadata that can be shared between different events. To help with that, there is a mixin keyword to specify metadata that can be shared. You can then use the extends keywork to import that data into your declaration, like this:

mixin Threadable
{
    @name = "Thread";
    @description = "The thread the event occured in.";
    @type = "thread";
    int thread;
};
...
@name = "Java Blocked";
@description = "Blocked on a Java monitor";
@color = rgb(255, 109, 100);
@path = "Java_Application/Monitor_Blocked";
event JavaMonitorBlocked extends Threadable, ClassLockable
{
};

Note, that when editing these files in Eclipse, you have editor support with full syntax highlighting. You can also use ctrl (command on Mac) clicks to jump around in the source, like this:

jump

Probes

The final section is the probes. These are quite like dscript probes, with the important difference that the emit keyword is used for emitting data. Here is an example:

probe read_io
syscall::*read:entry
/ pid == $processIdentifier /
{
    emit IORead(thread = tid, size = arg2);
}

It is also possible to pair events together to form duration events, using the begin and end keywords:

probe syscall_entry
syscall:::entry
/ pid == $processIdentifier /
{
    begin SystemCall(thread = tid, function = probefunc);
}
 
probe syscall
syscall:::
/ pid == $processIdentifier /
{
    end SystemCall(thread = tid, function = probefunc);
}

Note that the pairing is done by matching up the arguments.

Adding Your Own GUI

Mission Control has a built in GUI designer that allows you to redesign the GUI from within itself. Since the designer is somewhat tricky to use, it is not yet supported. However, if you can live with the quirks, it is quite useful. You can, for instance, easily build a custom user interface for your own events.

First you need to get into open the design view.

For JRockit Mission Control 4.1, this is most easily done from within the stand alone (RCP) version of the tool. This is how you enable it:

  1. Start JAVA_HOME/bin/jmc
  2. Press ctrl-1. The Commands view should open.
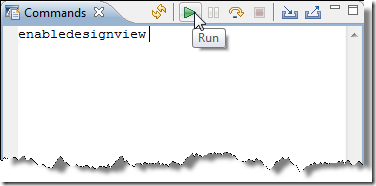
  3. In the Commands View, type enabledesignview, and press the play icon.

    commands
  4. The Designer View should open.

In late builds of Java Mission Control 5.2, this is simply done by selecting the Window->Show View->Designer menu. The designer view will control all the editing of your tabs, as well as control what tabgroups and tabs are available. It is also from the design view that you export your custom tabs as plug-ins. Now, the first quirk is:

You Must Prime Your Design View!

You prime it by loading a recording with the events that you want to build GUIs for. When you have loaded a recording, however, you cannot change the tabgroups or what tabs are available. So, if you want to add or remove tab groups or tabs, you normally directly close your newly opened recording. Yes. Quirk.

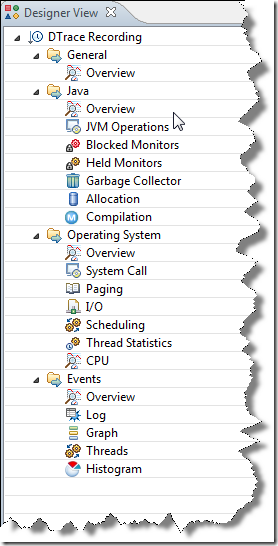
Designer view after opening recording:

designer1

Designer view after closing recording:

designer2

Now, to add a new tab group, you simply right click on the top node, and select New->New Group from the context menu. Add icons accordingly. If you want to change the relative position of your group, you can add a Placement Path. The Placement Path is a string that will be lexically compared with other strings to determine the position of the group. A placement path starting with ~ (tilde) is typically used to put a tab group towards the end.

To add a tab, simply right click on the tab group node, and select New->Tab.

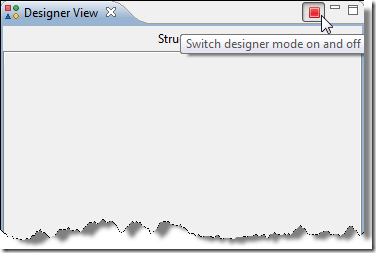
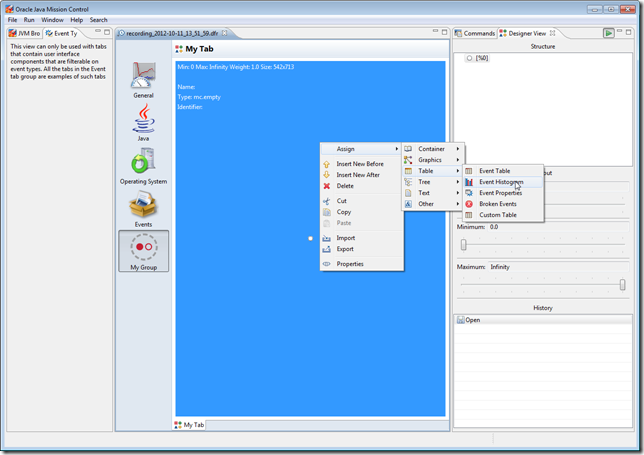
To edit your tab, load the recording containing the events for which you want to build a GUI, then press the stop button in the upper right corner of the Designer View. This will stop the GUI for that tab, and allow it to be edited. Assign components as required. For example, to add an event histogram:

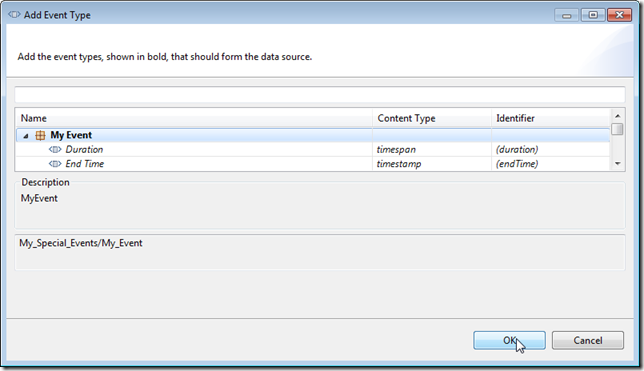
  1. Right click on the empty area, and select Assign->Table->Event Histogram:addhistogram
  2. Fill out an identifier (anything that helps you remember the component later)
  3. Go to the Columns tab and press the Browse button, then browse button again, and select your event:browse_event
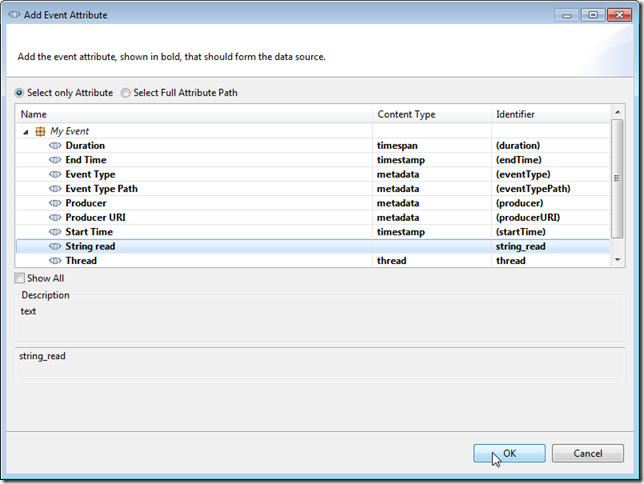
  4. Next click Group By and hit the Browse button. Select the attribute in your event that you want to group by:group_by
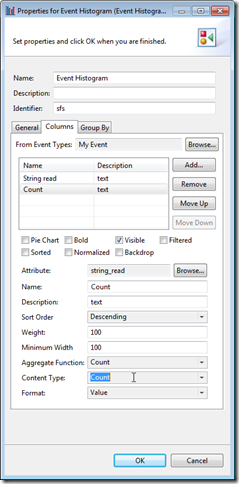
  5. Next add the columns you want in the table, by pressing add and selecting the attributes. For histograms, having the group by attribute first usually makes sense. You can easily make an event count field, by selecting any attribute, and then selecting Aggregation Function and Content Type to Count:

    count
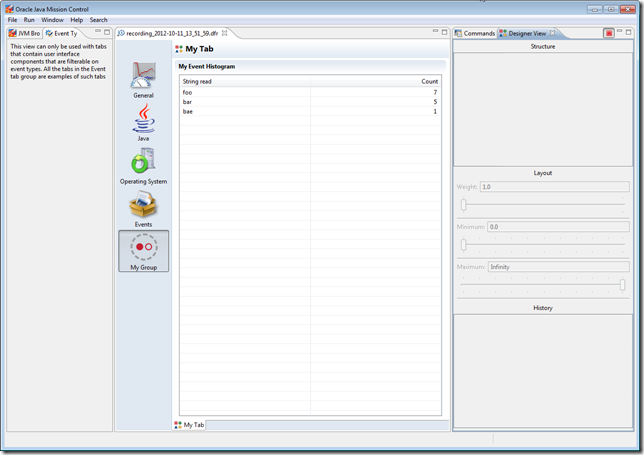
  6. Press play in the upper right corner to see your working user interface:

    donegui

Next you may want to store your new GUI as a plug-in, so that it can be shared with other users. This is easily done like this:

  1. Close your recording.
  2. Right click on the top node, and select Export UI to Plug-In.
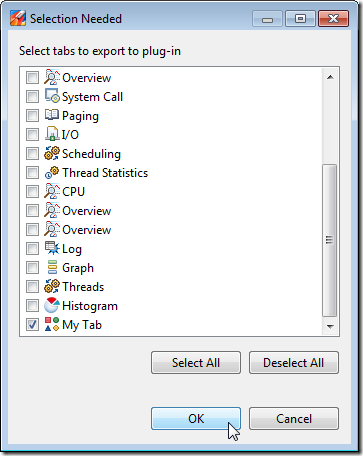
  3. Next select the tab to export. Note that you usually just want to export your own additions:select_tab_to_export
  4. Next select plug-in properties, such as the name and version. Note that higher versions of your plug-in will override older versions:

    plug-in-properties
  5. Finally select where it should be saved. Once exported, you can place the resulting jar file in the plug-in folder of another Mission Control to enjoy your user interface there.

That’s it! Have fun, and please let me know if you find this to be useful functionality that you would like the Mission Control team to continue to improve upon!

Big thanks to Klara Ward (@klaraward), the DTrace plug-in maintainer, for the help on this blog-post!