Controlling the Adafruit PWM Driver from Java

This article will show how to control the Adafruit 16CH 12 bit PWM driver from a Raspberry PI using Java.

  1. First step is to configure your Raspberry PI for I2C.
  2. Next step is to set up PI4J.
  3. Next is to download the tiny little library for accessing the PWM driver I just made (and/or the source).

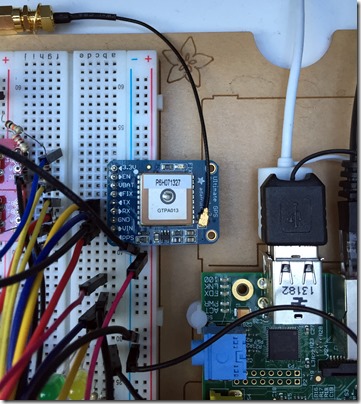
IMG_2385

This is the raspberry hooked up to various things, one of them being the PWM driver. The easiest way to test the library is to hook up a servo to channel 0 and run the jar. The test program also accepts a servo on channel 1, and motors (via H-bridges) on channel 2 and 3. Do not, under any circumstance, run the test program with servos on channel 2 and 3, unless you edit it first.

Here is how to run the test program:

sudo java -classpath .:classes:/opt/pi4j/lib/*:./pwm.jar se.hirt.pi.adafruit.pwm.test.PWMTest

You should see something like this:

And this is how to use it:

First construct a PWMDevice:

PWMDevice device = new PWMDevice();

If you’re using the default address (0x40) on I2C bus 1, you can safely use the default constructor. Next select the PWM frequency to use. 50 Hz is, for example, good for RC servo control:

device.setPWMFreqency(50);

Next select the channel for which you want to alter the PWM signal, for example channel 0:

PWMChannel servo0 = device.getChannel(0);

Setting the PWM signal is done with the setPWM(int on, int off) channel method. We have 12 bit fidelity with which to choose when to go from low to high, and vice versa. That gives us a valid number from 0 to 4095, with 0 meaning in the beginning of the pulse, and 4095 meaning the end. So, for most servos, the internetz say that a 1ms pulse means minimum servo travel, and a 2ms pulse means maximum servo travel. 1.5 ms is centered. 50Hz means every pulse is about 20ms. 1/20 of 4096 means that minimum servo travel should be about 205. Max travel should be around 410. Of course, your mileage may vary, and servos can usually travel a bit further than this. Anyways, this would be setting min:

servo0.setPWM(0, 205);

See the test program in the source jar for more examples. Have fun!

Conclusion and Tips

  • The Adafruit 16CH 12 bit PWM driver is a wonderful little breakout board for controlling servos and motors (via an H-bridge).
  • You can use 6V for driving the servos (V+) – just make sure that the servos can handle it.
  • Servos that are specified to handle 6V are usually faster/stronger when running on 6V.
  • I am using a Polulu voltage regulator for driving the Raspberry PI off of a 3S LiPo-battery. I am using a separate BEC for servos/motors.

My Favourite JMC Quotes

So, recently I came across some lovely JMC related quotes and articles. The first one is regarding the allocation profiling in JFR and how it does not affect scalarization (stack local allocation of objects):

http://psy-lob-saw.blogspot.se/2014/12/the-escape-of-arraylistiterator.html?utm_content=bufferc532a&utm_medium=social&utm_source=twitter.com&utm_campaign=buffer

“Java Mission Control is my current favourite profiler for the Oracle JVM.”

This tweet was heart warming too:

image

Not to mention that there were recently JMC presentations from Houston to Sri Lanka.

This, and maybe Christmas lighting induced general nostalgia, made me think of some other neat quotes I’ve seen regarding JMC.

Here are some of my favourite ones:

“Mission Control is what you wanted instead of profiler, but were afraid to ask.”

– Oleksandr Otenko, Oracle Performance Engineer

“JMC, because in my experience other tools cause way more harm than good.”

– David Buck, Oracle SE

“JMC is my main tool for getting insight into the rhythm of a JVM and the running applications. JMCs low overhead enables usage of an identical always-active setup in development and production environments. JMCs approach to recordings is very useful for creation of performance baselines to support both testing and profiling. I have used recordings extensively to document non-functional test results during development to validate SLA requirements and ensure good JVM citizenship. I have used recordings to resolve critical production issues caused by latency, memory-leaks or threading.”

– Allan Thrane Andersen, Trygg

“It’s an invaluable piece of work.”

– Maurizio Cimadamore, Oracle (Java Lang Tools)

“I managed to do in 1 day what I’ve tried to do in 2+ weeks using <tool> and <other tool>.”

– Maurizio Cimadamore, Oracle (Java Lang Tools)

“For the record: Java Mission Control is the best profiler ever, I use it daily, and so should you.”

– Marcus Lagergren, Oracle (Consulting Member of Technical Staff)

“If I could get only one present for Christmas, it would be Oracle Java Mission Control.”

– Morten G. Hermansen (tweet)

“I am ACS engineer since 2008, delivering local Middleware support to several customers. Since I started to work with Java/JRockit Mission Control, it became a key tool for my work, helping me to troubleshooting, identifying root causes and bottlenecks, and also for doing proactive follow up services to customers. Without it, I would be blind.”

– Iratxe Etxebarria, Oracle (ACS)

“JMC and JFR is really convenient tool. These helps with not only trouble shooting but also tuning. It means that JMC/JFR can reduce business impact of customers caused by less performance and application trouble.”

– Chihiro Ito, Oracle (Japan, Consulting group)

“JFR is an absolutely necessary function as much as AWR or DTrace. These are not nice-to-have but must-have.”

– Shingo Yamanari, Oracle (Japan, Sales Consulting)

“JFR is really impressive for partners in Japan. Members who have trouble shooting tasks totally understand the necessity of JFR.”

– Tomofumi Nijo, Oracle (Japan, Sales Consulting)

“JRockit Flight Recorder (JFR) provides detailed information of application runtime such as memory consumption, thread usage, etc. This kind of information will support trouble shooting by work for reproducing. Plus, JFR has less impact to a system because it runs with very low load. JFR provides deep insight of application behavior. It allows efficient system management, rapid trouble shooting and impact analysis.”

– Tadaaki Yoshida, Manager, NTT DOCOMO, INC.

“I love it, what a great tool! It is perfectly intuitive for me personally, maybe because I was a Precise consultant for years, during my time away from Sun/Oracle; JFR is like Precise, only done right :-)”

– Dave Fisk, Principal Software Engineer, Oracle

One might argue that the one from my friend Lagergren is a bit biased, but he really does use JMC all the time.

If you think I’ve left out an amazing quote, or if you’d like to share one, please drop me an e-mail! 🙂

JMC Tutorial

I know. JavaOne has already come and gone, and I promised, after my JavaOne submission snafu, to publish a Tutorial here by the end of JavaOne. Well, life happened, and here we are, a few weeks after JavaOne.

That said, here it is finally, the first draft of the JMC tutorial:

http://hirt.se/downloads/oracle/jmc_tutorial.zip

The tutorial instructions are in the JMC_Tutorial.pdf included in the root of the zip.

In this tutorial you can:

  • Install JMC (either the stand alone version, the Eclipse version, or both)
  • Do Java Flight Recordings
  • Analyse Flight Recordings
  • Watch a laser kill monsters
  • Use experimental plug-ins such as the Java FX and WLS plug-ins for Flight Recorder, as well as JOverflow for doing memory dump analysis.
  • Get to play with jcmd

The Tutorial has hours worth of material, so do the exercises that you find the most interesting first. Also, you may want to print out the tutorial and keep it beside your computer to minimize the switching back and forth between JMC, Eclipse and the pdf.

Hope you find this helpful!

(Please don’t hesitate to send suggestions or any bugs/typos found my way!)


Other Resources

Here are some other blog posts that will make for fine companions to the Tutorial:

Improving the Fidelity of the JFR Method Profiler

One nice property of the JFR method profiler is that it does not require for the threads to be at safe points for stacks to be sampled. However, since the common case is that stacks will only be walked at safe points, HotSpot normally does not provide metadata for non-safe point parts of the code, which means that such samples will not be properly resolved to the correct line number and BCI. That is, unless you specify:

-XX:+UnlockDiagnosticVMOptions -XX:+DebugNonSafepoints

With the DebugNonSafepoints, the compiler will generate the necessary metadata for the parts of the code not at safe points as well.

Big thanks to Doug Simon and Gilles Duboscq for noting this!

My Sessions at JavaOne 2014

So despite my recent blog of despair, I am now involved in two sessions at JavaOne 2014. Another Oracle session had to be cancelled, which allowed some room for a session on how to use the Java Flight Recorder. There will likely be a guest appearance from another Oracle team on that session too. 🙂

So here are the sessions I am involved in:

Using Oracle Java Flight Recorder [CON10912]

The former Oracle JRockit Mission Control, a feature of Oracle Java SE Advanced, is now called Oracle Java Mission Control. This tools suite includes tools for monitoring, managing, and profiling your Java application without introducing the performance overhead normally associated with tools of this type. One of the most important components of Oracle Java Mission Control is Oracle Java Flight Recorder. This session discusses how to use Oracle Java Flight Recorder to analyze various aspects of Java programs running on Oracle’s HotSpot JDK.

The presentation
• Explains how Oracle Java Flight Recorder works
• Shows different ways to control Oracle Java Flight Recorder
• Shows examples of how to analyze recordings in different ways

Tuesday, Sep 30, 5:30 PM – 6:15 PM – Hilton – Continental Ballroom 4

and:

Be in Control of Your JavaFX Mission [CON2262]

Starting with JDK 8u20, Java Flight Recorder (JFR) and Java Mission Control (JMC) can help you look under the hood of the JavaFX runtime to better understand the behavior of your application. This session takes you on a tour of all the steps from launching your app to visualizing collected data in the JavaFX plug-in of JMC. It provides a brief overview of the JavaFX architecture required to correctly interpret and analyze presented data. JavaFX developers will learn how interaction with JFR is implemented in the JavaFX runtime and how it can be extended to collect and visualize information they need. 

Thursday, Oct 2, 11:30 AM – 12:30 PM – Hilton – Plaza B

Looking forward to seeing you there! 🙂

JavaOne 2014 and The Mistake of the Year

Soooo, this was a pretty hectic year. What with the relocation to Switzerland and all. Internally within Oracle I submitted two talks of my own for consideration to JavaOne 2014, plus one together with Oleg Mazurov. They were all internally accepted within Oracle to be submitted to the JavaOne 2014 conference call for papers. Guess who forgot to actually submit the talks? Yep.

That said, all is not lost. Oleg did not forget to submit the one I will be co-presenting with him.

This is the talk:

Be in Control of Your JavaFX Mission [CON2262]

Starting with JDK 8u20, Java Flight Recorder (JFR) and Java Mission Control (JMC) can help you look under the hood of the JavaFX runtime to better understand the behavior of your application. This session takes you on a tour of all the steps from launching your app to visualizing collected data in the JavaFX plug-in of JMC. It provides a brief overview of the JavaFX architecture required to correctly interpret and analyze presented data. JavaFX developers will learn how interaction with JFR is implemented in the JavaFX runtime and how it can be extended to collect and visualize information they need. 

Thursday, Oct 2, 11:30 AM – 12:30 PM – Hilton – Plaza B

If anyone wants to meet up, I will be in SF on Thursday. Also, since I screwed up, I will make amends by:

  • Publishing a JMC tutorial on the Mission Control home page.
  • Publishing it by the end of JavaOne.
  • Making it more comprehensive than the HoL I was planning for JavaOne.

I’ll say something on my twitter when the tutorial is available.

Hope to see you at JavaOne! 🙂

Java Mission Control 5.4.0 Released!

Yay! Today a new version of Java Mission Control was released together with 8u20! This blog entry will provide a quick summary of some of the new features and fixes in JMC 5.4.0. Since I didn’t write anything when the 5.3.0 was released, I will cover a few features that were already included in 5.3.0. Both the 5.3.0 and 5.4.0 are minor, incremental releases, so there are no radical changes. Those will happen in JMC 6.0, which is where most of the development effort has been taking place for a while now. 😉

New Plug-ins!

Two new plug-ins were introduced with JMC 5.4.0: the Java FX plug-in and the Eclipse IDE launcher plug-in. The Java FX plug-in can be installed in both the stand alone and Eclipse plug-in version of JMC, whilst the launcher plug-in is only available for the Eclipse plug-in version of JMC.

The Java FX plug-in

In 8u20 Java FX integrates with the Java Flight Recorder, producing events about Java FX pulses and input events. With JMC 5.4.0 there is an experimental plug-in that can be downloaded into JMC which provides custom visualization for these events.

javafx 

Using the plug-in, you can quickly look at the pulses and see how much time was spend in the different phases.

javafx_input

And for completeness, above is a picture of the view for the input events. If you’d like, you can use the built in GUI editor to spice it up further:
javafx_input_spiff

The Launcher Integration plug-in

The launcher integration plug-in makes it easier to run your applications from within Eclipse with the Java Flight Recorder enabled. A new alternative is added to the “Run As” menu when the plug-in is installed – Java Application with Flight Recorder.

runwithjmc

A new launcher alternative will be available, “Java Application With Flight Recorder”, which adds an extra tab in the Eclipse Run Configuration dialog to help you launch your Java application with a flight recording running.

launchconfig

At the bottom of the Flight Recorder launcher tab you will see the JFR related arguments that will be added to the VM arguments to make it all happen.

Miscellaneous Enhancements

Aside from the two plug-ins, there are quite a few enhancement to the base JMC product. I’ve selected a few user facing ones. (The pictures can be clicked for higher resolution versions.)

  • You can now select how to aggregate method frames in stack traces, either by method (default), line number or by byte code index (or any combination). When you choose line number, you will now see the line numbers in the stack trace view. For BCI the recording must have been created with 8u20 or later.
    frames_by_line_number
  • The dump JFR trigger action no longer requires a default recording to operate upon. Any ongoing recording will do.
  • Using ctrl+mouse wheel in the thread graph in the Flight Recorder UI to zoom, will now zoom towards the mouse pointer.
    zooming
  • JMC will now choose the stronger AES/SHA-2 cipher over triple DES/SHA-1, if available, for PBE.
    cipher
  • In 5.3.0 a new content type system was introduced. It is currently only used in the JMX console, but will be used all over Mission Control in 6.0.0 and later. The content type system associates a value with its physical quantity and unit of measurement, making it possible for JMC to render the value better and for the user to input values in a much more convenient way. For example, in the Memory Pool MBeans it is possible to set a usage threshold. Previously a (usually) very long number stating the number of bytes would have to be entered. Now that value can be entered with whatever unit you please.
    content_type 
    Attributes that have no physical quantity and unit specified can have one set by the user. custom_units
    The best would of course be if there was a standardized way of adding this metadata to the MBean attributes themselves, instead of (only) to the JMC JMX console. We hope to include such metadata in the JMX spec in the future.
  • Also in 5.3.0, the console tab groups and tabs were redistributed and normalized, so that no tab groups would need to be visible by default.
    console 
    Installing plug-ins may make the tab groups area re-appear.
  • In 5.3.0 there was a new context action introduced for copying stack traces to the clipboard (JFR).
  • There was also a new user interface introduced showing the VM flags (JFR).
    vmflags
  • Attributes with the same update interval and on the same MBean are now fetched at the same time to minimize roundtrips.
  • In the memory tab, there is now the possibility to take heap histograms. Note that you need to be connected to a JDK 8 JVM for this to show up.
    heap_histogram
    Click the Update Heap Histogram button to take a new snapshot. The difference between the two last ones will be calculated and shown in the Delta column.

Bugfixes

We’ve also fixed a bunch of bugs! I’ve selected a few:

  • The dropins folder now works as expected. To install a plug-in, it can simply be dropped into the JDK_HOME/lib/missioncontrol/dropins folder.
  • Installing experimental plug-ins in a shared installation now works. Previously installing plug-ins in a shared installation could fail silently.
  • JMC and JFR did not agree on how to specify some time units, making it impossible to use recording templates containing time values specified in minutes interchangeably as server side and client side templates. Fixed.
  • JMC no longer hangs when starting up on Mac (due to an SWT/Swing interop problem on Mac OS X – we have a workaround).

Summary

  • There is a new version of Java Mission Control available now – JMC 5.4.0.
  • It is shipped with Oracle JDK 8u20.
  • It is also available as a set of Eclipse plug-ins.
  • Even though most of the development effort is put into the next major version of JMC, there are lots of useful new features and bug fixes in these incremental releases.


Further reading and useful links

Related Blogs:
Creating Flight Recordings
Low Overhead Method Profiling with Mission Control

The Mission Control home page:
http://oracle.com/missioncontrol

Mission Control Base update site for Eclipse:
http://download.oracle.com/technology/products/missioncontrol/updatesites/base/5.4.0/eclipse/

Mission Control Experimental update site (Mission Control plug-ins):
http://download.oracle.com/technology/products/missioncontrol/updatesites/experimental/5.4.0/eclipse/

The Mission Control Facebook Community Page (not kidding):
http://www.facebook.com/pages/Java-Mission-Control/275169442493206

Mission Control on Twitter:
@javamissionctrl

Me on Twitter:
@hirt

Moving to Switzerland – hirt.se will be down!

Hi friends!

Sorry for the radio silence lately. I’ve been spending a lot of time preparing for my family’s relocation to Switzerland. Since I will be bringing my computers, and since traveling from Sweden to Switzerland is far from instantaneous, this means that hirt.se will be down for a couple of days. Minimum. Murphy’s law says it could be weeks.

The server is unplugged the 21st of June. With lots of luck it will be up again by the 23rd. Sorry about the upcoming interruption.

Have a great summer and happy coding! 🙂

/M

Executing Diagnostic Commands Using Attach

Sometime it can be very useful to have programmatic access to the Diagnostic Commands available in the Oracle JRE. This is of course both highly dependent on the Oracle JDK and very unsupported, so, as usual, please use responsibly.

Here comes the usual disclaimer:

The following blog entry will describe UNSUPPORTED functionality. This means that relying on the described APIs or functionality may BREAK your code/plugin with any given update of the JDK and/or Mission Control.

The Attach API

There is an API that allows a Java process to attach to another Java process. This is the API used by several different Java tools to both enumerate the locally running Java processes, as well as do things like start up the management agent. The API is usually just called the Attach API, and one of the entry points is the com.sun.tools.attach.VirtualMachine class.

You can use the VirtualMachine class to enumerate all the locally running Java processes (with the same effective user as the process doing the listing) on the machine like this:

List<VirtualMachineDescriptor> vmList = VirtualMachine.list();
for (VirtualMachineDescriptor descriptor : vmList) {
    System.out.println(String.format(“%s %s”, descriptor.id(), descriptor.displayName()));
}

This is how you attach to a running Java process:

VirtualMachine.attach(<PID>); 

<PID> is the process ID as a String. The reason it is a String is probably to not assume that all Operating Systems use integer values for their process identifiers. I guess having the identifier as a String could also come in handy when addressing Isolates/MVM and other more complicated scenarios where what constitutes the “Java Process” becomes a bit more blurry. Anyways, once you have your VirtualMachine there is all kinds of fun you can do, like loading Java agents and agent libraries etc. The most important thing, however, is to detach. Never forget to detach, or you will start leaking process handles.

Invoking Diagnostic Commands

To invoke diagnostic commands, we will need to cast our VirtualMachine to a HotSpotVirtualMachine. Here is how to execute the Thread.print DiagnosticCommand:

VirtualMachine vm = VirtualMachine.attach(<PID>);
HotSpotVirtualMachine hsvm = (HotSpotVirtualMachine) vm;
hsvm.executeJCmd(“Thread.print”);

Or, here as a compilable example:

import java.io.BufferedInputStream;
import java.io.ByteArrayOutputStream;
import java.io.IOException;
import java.io.InputStream;

import sun.tools.attach.HotSpotVirtualMachine;

import com.sun.tools.attach.AttachNotSupportedException;
import com.sun.tools.attach.VirtualMachine;

public class DiagnosticCommandExample {

    public static void main(String[] args) throws AttachNotSupportedException,
            IOException {
        if (args.length == 0) {
            System.out.println(“Usage: InvokeDiagnosticCommand <PID>”);
            System.exit(2);
        }
        VirtualMachine vm = VirtualMachine.attach(args[0]);
        if (!(vm instanceof HotSpotVirtualMachine)) {
            System.out.println(“Only works on HotSpot!”);
            System.exit(3);
        }
        HotSpotVirtualMachine hsvm = (HotSpotVirtualMachine) vm;
        System.out.println(readInputStreamAsString(hsvm.executeJCmd(“Thread.print”)));
    }

    public static String readInputStreamAsString(InputStream in)
            throws IOException {
        BufferedInputStream bis = new BufferedInputStream(in);
        ByteArrayOutputStream buf = new ByteArrayOutputStream();
        int result = bis.read();
        while (result != -1) {
            byte b = (byte) result;
            buf.write(b);
            result = bis.read();
        }
        return buf.toString();
    }
}

Summary

Using the attach API is not supported and the APIs may change at any time. That said, it can still be quite useful for putting together small utilities.

Clarification: Alan Bateman pointed out to me that whilst linking to the sun.tools.attach.HotSpotVirtualMachine class is indeed unsupported, the Attach API in itself is supported and documented.

Building a Custom JMC JMX Console Plug-in

Last week I ran into Gerrit Grünwald (@hansolo_) whilst demoing JMC in the Oracle booth at JFokus. I’d built a little RPi sensor board to have in my summer house, and since there is a lot of interest in the Internet of Things, I thought I’d contribute by showing how easy it is to hook up the JMX Console to one of those things.

sensor_board  temp

We also had a very neat demo sporting a plug-in for the JMC console for controlling our resident LEGO robot (caught in an intimate moment with another robot in the picture below).

robot_love mindstorms_demo_ui

Anyways, Gerrit wanted to know how to extend the JMC JMX Console with custom JavaFX visualization. Since the Java FX part will be much easier once JDK 8 and JMC 5.3.0 is out, I’ll leave that for a (not too distant) future blog post. Here is the first step though – how to build your own JMC console plug-in!

Preparations

The easiest way to get going is by installing the JMC PDE plug-in into Eclipse.

    1. Get an Eclipse classic
      For JMC 5.2, get Eclipse 3.8.2 up to 4.2.x (Juno)
      For JMC 5.3 (out soon), get Eclipse 3.8.2 and any 4.x (Kepler will work fine)
    2. Install JMC from the update site
      The update site link can be found here: http://www.oracle.com/missioncontrol
      Follow the installation instructions.
      Note: Later releases of Eclipse are pickier about certificate validation – if you run into problems because download.oracle.com maps to akamai hosts, try using http instead of https in the update site URL.
    3. Next install the PDE plug-in from the experimental update site
      The URL for the experimental update site can be found on the Mission Control page too: http://www.oracle.com/missioncontrol
      The plug-in to install is the Development/Java Mission Control PDE Integration one.

Next you need to set the target platform to your JMC installation.

    1. Go to Preferences
    2. Type targ in the filter box and select the “Target Platform” node in the preferences tree
    3. Click Add, to open the wizard for adding a new target platform
    4. Click next, since you want to start with an empty target definition
    5. Name the target JMC and click Add
    6. Select Installation and hit Next
    7. Select your JAVA_HOME/lib/missioncontrol folder
    8. Hit Finish

You are now set to start developing your first Mission Control plug-in.

JMC JMX Plug-in Hello World

First we need to create a new plug-in project. Select File | New | Other. Select Plug-in Project and hit next. Name your project and hit next. Name your plug-in and hit next. Now you should be able to select a custom wizard for creating a JMC console plug-in:

templates

Select Simple Mission Control Console Tab Wizard and hit Next. Change the class name and tab name to your liking and finish the wizard. You should now have a new project. With the current 5.2.0 PDE plug-in, you may have a weird compilation error due to an unnecessary import as well. If you do, simply right click on the offending class and choose organize imports to get rid of the import (remember to save the class after fixing the problem):

organize_imports
You can now run Mission Control with your new plug-in by selecting the project and choosing Run As | Eclipse Application from the context menu. If you connect with the management console, you should see something like this:

HelloJMC

Building the Plug-in

This is how you build your plug-in:

    1. Select the plug-in project and choose Export… from the context menu
    2. In the following wizard, select Deployable plug-ins and fragments
    3. Select a Directory for where to put the plug-in and hit Finish.

That’s it. You should now have a plug-in jar file.

Installing the Plug-in

How easy it is to install your plug-in depends on the version of JMC you are using.

For 5.3.0 you simply copy the plug-in into the JMC_HOME (i.e. JDK_HOME/lib/missioncontrol) dropins folder. Done!

For 5.2.0 this is quite a lot more elaborate. You first need to generate some p2 metadata. This can be done using Eclipse like this:

eclipse -application org.eclipse.equinox.p2.publisher.FeaturesAndBundlesPublisher -metadataRepository <metadatadir> -artifactRepository <metadatadir> -bundles <pluginsfolder> -compress –publishArtifacts

Where <metadatadir> is where you want the metadata published, and <pluginsfolder> is the plug-ins folder where you exported your plug-in.

For example:

macbookpro:~marcus$ /Users/marcus/Applications/eclipse_4.2.2/Eclipse.app/Contents/MacOS/eclipse -consoleLog -application org.eclipse.equinox.p2.publisher.FeaturesAndBundlesPublisher -metadataRepository file:/Users/marcus/Builds/repo -artifactRepository file:/Users/marcus/Builds/repo -bundles /Users/marcus/Builds/plugins -compress -publishArtifacts

The result in <metadatadir> should be two jars and a plugins folder with your plug-in in it.

Next you need to tell p2 to install the plug-in. JMC includes the p2 director, so installing can be done like this (using sudo for administrative rights – on windows you might want to open a shell with admin rights):

sudo jmc -nosplash -application org.eclipse.equinox.p2.director –repository <metadatadir> –installIU <pluginname>/<full version> -destination <jmchome> -profile JMC

For example:

macbookpro:~marcus$ sudo /Library/Java/JavaVirtualMachines/jdk1.7.0_45.jdk/Contents/Home/lib/missioncontrol/Java\ Mission\ Control.app/Contents/MacOS/jmc -nosplash -application org.eclipse.equinox.p2.director -repository file:/Users/marcus/Builds/repo -installIU se.hirt.blogs.jmxconsole/1.0.0.201402132124 -destination /Library/Java/JavaVirtualMachines/jdk1.7.0_45.jdk/Contents/Home/lib/missioncontrol/ -profile JMC

Uninstalling

If you wish to uninstall the plug-in, you just remove it from the dropins folder in 5.3.0. For 5.2.0 you use the uninstallIU command:

sudo jmc -nosplash -application org.eclipse.equinox.p2.director –uninstallIU <pluginname>/<full version> -destination <jmchome> -profile JMC

For example:

macbookpro:~marcus$ sudo /Library/Java/JavaVirtualMachines/jdk1.7.0_45.jdk/Contents/Home/lib/missioncontrol/Java\ Mission\ Control.app/Contents/MacOS/jmc -nosplash -application org.eclipse.equinox.p2.director -uninstallIU se.hirt.blogs.jmxconsole/1.0.0.201402132124 -destination /Library/Java/JavaVirtualMachines/jdk1.7.0_45.jdk/Contents/Home/lib/missioncontrol/ -profile JMC

Summary

This blog entry described how to create a custom plug-in for the Java Mission Control JMX Console, and how to install the newly created plug-in. The installation process of custom plug-ins is simpler in the upcoming 5.3.0 version of Mission Control.