Recently I had a talk at Code One about using OpenTracing together with the JDK Flight Recorder to do deep tracing. Since the session wasn’t recorded, I though I’d do a blog about it instead. Here we go…
Distributed tracing has been of interest for a very long time. Multiple companies have sprung up around the idea over the years, and most APM (Application Performance Management) solutions are built around the idea. Google released a paper around their large scale distributed systems tracing infrastructure in 2010 – Dapper, and there are now several open source alternatives for distributed tracing available inspired by the paper, such as Jaeger and Zipkin.
In Java land, pretty much all of the APMs are doing pretty much the same thing: they use BCI (byte code instrumentation) for getting the data, and then they present that data to the end-user in various ways, oftentimes using some kind of analysis to recognize common problems and suggesting solutions to the end users of the APM. The real differentiation is knowing what data to get, and what to do with the data once captured.
Since there was no standard, one problem was for vendors to inject helpful, vendor specific, information into the distributed traces. The vendor of a software component may have a quite good idea about what information would be helpful to solve problems. Some vendors support APM specific APIs for contributing the data, but more often than not the instrumentation is done using BCI by scores of developers working for the various APM companies. The same is true for maintainers of open source components – either skip the problem entirely and let the APM vendors come up with good instrumentations points (if your component is popular enough), or pick a popular APM and integrate with it. That is, until OpenTracing came along…
Introduction to OpenTracing
OpenTracing is an open source, vendor neutral, distributed tracing API. In other words, library developers can interact with one API to support multiple APM/Tracer vendors. Also, customers can add contextual information to distributed traces without worrying about vendor lock-in. Contributors to OpenTracing include LightStep, Jaeger, Skywalking and Datadog, and the specification is available on GitHub:
The core API concepts in OpenTracing are (from the slides of my talk, DEV5435):
Also worth noting is that a Scope is a thread local activation of a span.
The Example
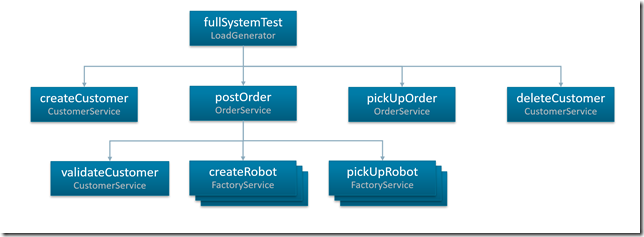
As an example, we’ll be using a simple application consisting of three microservices. It is part of the back-end of a fictional robot store. Robots can be ordered at the Orders service, and they will be produced in a Factory. There is also a Customers service keeping track of the customers. Finally there is a load generator that can be used to exercise the services.
The code is available under https://github.com/thegreystone/problematic-microservices. (Yes, as the name indicates, the services come pre-packaged with built-in problems. :))
The services, as well as the load generator, have built-in tracing support, so for a full systems run with the load generator, you would get a trace (a DAG of spans), looking something along the lines of:
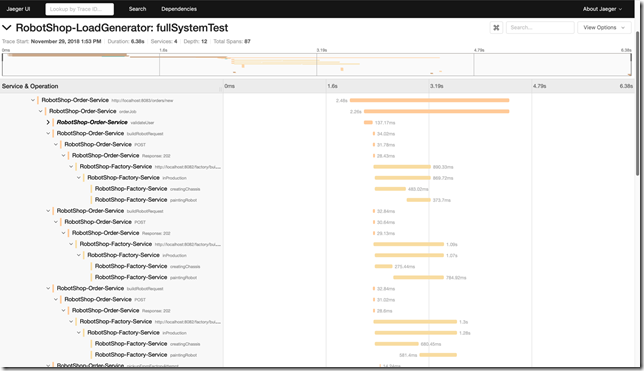
Or, in Jaeger, where you have time on the X axis:
In this case I have scrolled down a bit to focus on the factory. As can be seen, there is great variability in the time it takes to create a chassis and/or paint a robot. We have multiple production lanes, and we’d expect times across the factory lanes to be more even, not to mention much faster. So what gives?
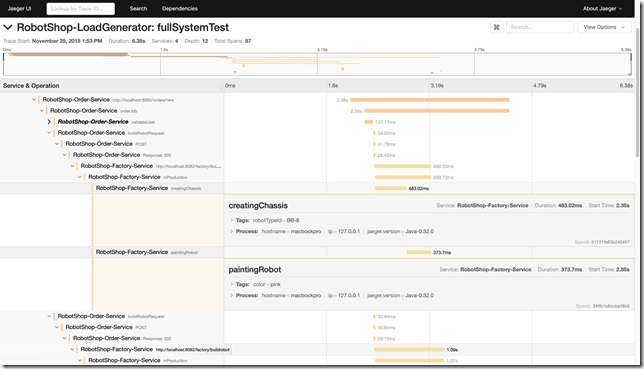
Well, we can expand the operation to see if there was some additional information:
Now, sometimes the tags may include crucial pieces information that may help you solve the problem without needing any additional information. In this particular case, though, knowing that we were building a pink BB-8 isn’t really doing the trick.
What would be the next step? All too often the next step would be to look at the code around the instrumentation point, trying to figure out what was going on at the time simply from analyzing the code. Sometimes that may be quite hard. The problem may be in third party code not expected to behave badly. There may even be some other piece of code not directly in the code path causing the problems, perhaps an agent misbehaving and causing long lasting safe points in the JVM.
So, we’re screwed then? Nah. What if you had a magic tool that could record what was going on in the JVM and the application at the time of the incident? Something providing not only method profiling information, but a deeper view, including information about vm operations, memory allocation profiling, events for the usual application caused thread halts and much, much more. Something that could be always on, with very low overhead. And let’s say you ran with a tracer that added some contextual information, such as information that could be used to identify traces, spans and thread local span activations in the recorded data, and which allowed you to use your favourite tracer too? Then things would get interesting indeed…
Running with the JFR Tracer
For Code One I wrote a little delegating JFR tracer, which allows you to record contextual information into the flight recorder. It was meant as an example on how to do deep distributed tracing. Deep enough to solve entire classes of problems that are hard to solve without more detailed knowledge.
The tracer works with Oracle JDK 7+ and OpenJDK 11+ (it is a multi-release jar, a.k.a. mrjar), and the source is available on GitHub here:
The bundle is available from Maven Central, and here is the dependency you need to add:
<dependency>
<groupId>se.hirt.jmc</groupId>
<artifactId>jfr-tracer</artifactId>
<version>0.0.3</version>
</dependency>
Next you need to initiate your tracer and pass it to the constructor of the DelegatingJfrTracer, like so:
GlobalTracer.register(new DelegatingJfrTracer(yourFavTracer));
That’s it. When the tracer is running you will get contextual information recorded into the flight recorder.
Looking at the Recording
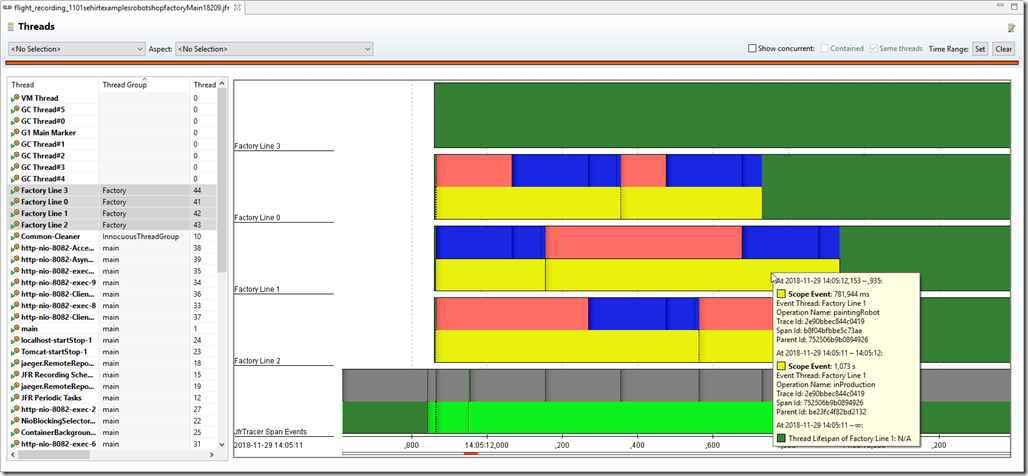
Dumping the flight recorder for the factory, and looking at the dump in the Threads view, might look something like this:
We can see that we have these long lasting monitor enter (Java Blocking) events, and looking at the stack traces directly by selecting individual events, or at the Lock Instances page, it is fairly obvious where the contention is:
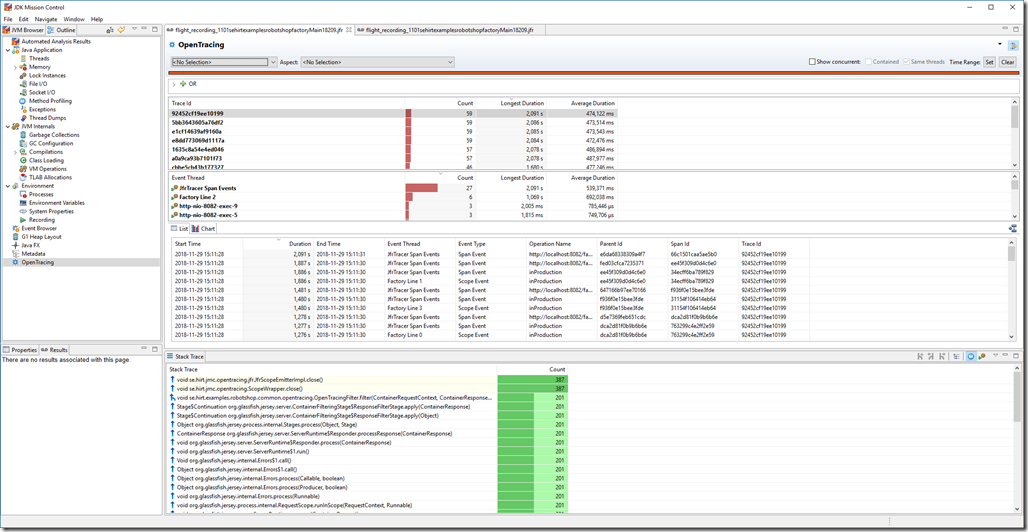
We can, of course, create a custom OpenTracing view to make it easier to directly finding and homing in on long lasting traces (I’ll create a repo for a ready made one with some more flair at some point). Simply go the the Event Browser, and right click on the Open Tracing folder. Select “Create a new page using the selected event types”. You will now have a new page in the Outline. You can right click on the title on the page to rename it and switch icon.
Next select an arbitrary event, and right click on it. Select Group-By->Trace Id. In the new Group By table that appeared, select Visible Columns to enable (at least) the attribute showing the longest duration (the total duration of (wall clock) time the trace spent in the process that the recording came from). Next sort on the Longest Duration column.
In this case I’ve ran a few more (press enter in the single step load generator a few times, or let it just continuously add load):
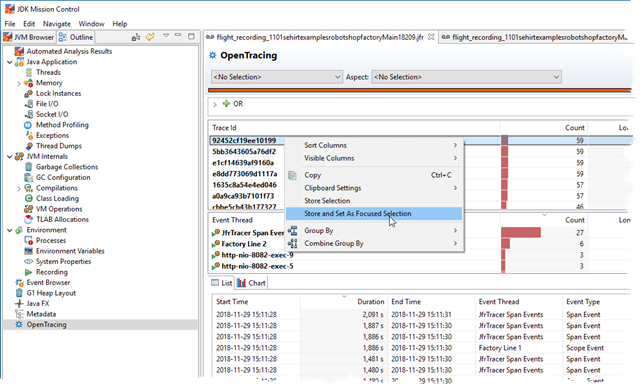
You can, of course add additional tables with groupings that can be useful, for example, per thread. To quickly home in the entire user interface on a trace id of interest, just select a trace and choose “Store and Set as Focused Selection”:
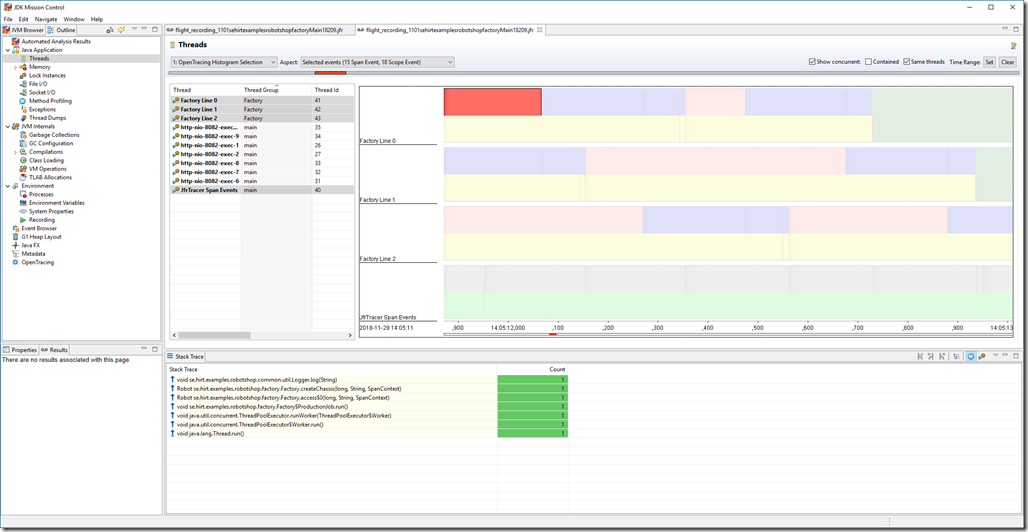
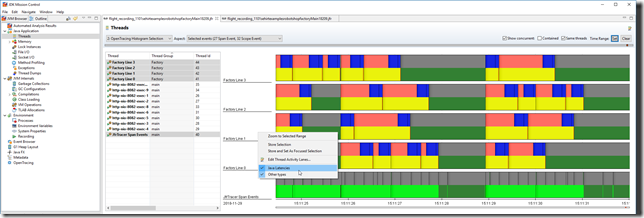
Now you can go back to, for example, the Threads view, and click the Time Range: Set button in the upper right corner. Voila, you are in exactly the right place. You may also want to view concurrently occurring events in the same threads (see check boxes on top), and enable additional thread lanes:
Summary
- Distributed tracing is great, especially in today’s world of (very µ and plenty) µ-services.
- For the Java platform, injecting trace/span-identifying information as contextual information into the JDK Flight Recorder is dynamite.
- A simple example on how to do this automagically is available on my GitHub as a delegating Tracer, in an mrjar, supporting Oracle JDK 7+ and OpenJDK 11+:
https://github.com/thegreystone/jfr-tracer - The slides for my Code One presentations can be found here:
https://oracle.rainfocus.com/widget/oracle/oow18/catalogcodeone18?search=hirt
(The relevant session for this blog is DEV5435.) - The JDK Flight Recorder r0xx0rz.
- JDK Mission Control r0xx0rz.
Note that since the article was written, I have donated the tracer to OpenTracing.
See https://github.com/opentracing-contrib/java-jfr-tracer.
