The next version of JRockit Mission Control just went live! Feature-wise it is only a minor upgrade, I will go into detail about the most exciting one in a bit, but there are some other changes to this release that are quite profound.
The, in my humble opinion, greatest change is that all JRockit Mission Control features are available by default. There is no need to dabble with licenses. Everything is free to use for evaluation, which among other things means that you can now try out the latency analyzer properly.
JRockit Mission Control has also been relocated to a new homepage at OTN, located at http://www.oracle.com/technology/products/jrockit/missioncontrol/index.html. The next few days a lot of new JRockit Mission Control related material will be posted there.
The update site has moved as well, and can now be found at http://www.oracle.com/technology/software/products/jrockit/missioncontrol/updates/eclipse-3.3/jrmc/.
As you will undoubtedly notice, everything has also been re-branded.
Now, the cool new feature is actually a JRockit JVM side upgrade, that will be automatically picked up by the JRockit Mission Control client. It is now possible to do very cheap memory allocation profiling using the JRockit Latency Analyzer.
There is a new type of latency events available in the latency recordings. They are triggered whenever the JRockit JVM needs to acquire a new Thread Local Area or whenever the JRockit JVM needs to allocate a new large object. These events provides a good approximation to what is causing the most pressure on the memory system. This means that it is quite easy to find out where to start optimizing allocation behaviour using JRMC LAT.
Here is an example:
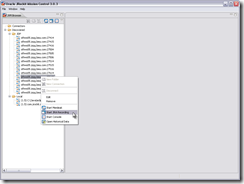
- First select the JVM you wish to start a JRA recording on.
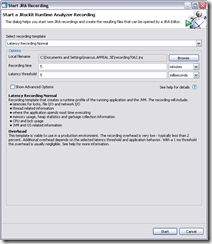
- In the JRA recording wizard, ensure that you start a JRA recording with latency information in it.
You can for example use the Latency Recording Template.
- Then open the Latency Log tab and open a histogram over the events.
Make the histogram over the Object Allocation – Class Name property by selecting it in the second combo box.

Note: since the allocation events aren’t recognized yet as being from the standard producer, you may need to enable them in the event palette to the left.As you can see, most of the pressure on the memory system seems to be from the allocations of Strings. This is not uncommon. Together with arrays of primitive types, Strings are quite commonly high ranking here.
- Now right click on the String row in the table, and set the operative set to the events corresponding to that row.
The selected event property will unfortunately be reset, which will cause the histogram to be reset as well, but never mind that.
- Move over to the Latency Traces view and check that you only want to see the events in the operative set.

You can now clearly see exactly where you need to reduce the amount of String allocation to reduce the pressure on the memory system.
Reducing the pressure on the memory system leads to less frequent garbage collections and thus a more responsive system.
For more information on the JRockit JVM R27.6 release, please have a look at the release notes.


